Category Archives: C#

Displaying NDI sources on Stream Decks

In the course of my work on our local church A/V system, I’ve spent quite a lot of time playing with Elgato Stream Decks and NDI cameras. It only occurred to me a week or so ago that it would be fun to combine them.

The Stream Deck screens are remarkably capable – they’re 96×96 or 72×72 pixels (depending on the model) and appear to have a decent refresh rate. I tend to think of them just in terms of displaying simple icons or text, but I’d already seen a video of a Stream Deck displaying a video so it wasn’t too much of a leap to display live camera outputs instead.

I should make it clear that I had absolutely no practical reason for doing this – although as it happens, the local tweaks I’ve made to the C# NDI SDK have proved useful in At Your Service for enabling a preview camera view without opening a second NDI network stream.

Tweaking the NDI SDK

The NDI SDK comes with a demo C# sample library. It’s not clear how much this is intended to be for production use, but we’ve been using it in At Your Service for quite a while with very few issues. (We’re pinned at a slightly old version of the runtime due to some smoothness issues with later versions, which I’m hoping the NDI folks will sort out at some point – I’ve given them a diagnostic program to show the issues.)

The SDK comes with a WPF “receive view” which displays a camera in a WPF control, as you’d expect. Now I don’t know enough about WPF to try to use the Stream Deck as an output device for WPF directly. It may be feasible, but it’s beyond my current skillset. However, I was able to reuse parts of the receive view to create a new “display-agnostic” class, effectively just dealing with the fiddly bits of the NDI interop layer and providing video frames (already marshalled to the dispatcher thread) as raw data via an event handler. Multiple consumers can then subscribe to that event and process the frames as they wish – in this case, drawing them to the Stream Deck, but potentially delivering them to multiple displays at the same time.

The simplest image processing imaginable

So, the frames are being delivered to my app in a raw 4-bytes-per-pixel format. How do we draw them on the Stream Deck? I’ve been using StreamDeckSharp which is has been pretty simple and reliable. It has multiple ways of drawing on buttons, but the one we’re interested in here is passing in raw byte arrays in a 3-bytes-per-pixel format. (As it happens, the Stream Deck SDK then needs to encode each frame on each button as a JPEG. It’s a pity that the data can’t be transferred to the Stream Deck in raw form, but hey.) All we need to do is scale the image appropriately.

Again, there may be better ways of doing this, such as asking WPF to write the full frame to a Graphics and performing appropriate resizing along the way. But I figured I’d start off with something simpler – and it turned out to be perfectly adequate. I’m not massively concerned with obtaining the absolute best quality image possible, so rather than using all the pixels and blending them appropriately, I’m just taking a sampling approach: if I’m displaying the original 1920×1080 image on a 96×96 button, I’ll just take 96×96 pixel values with as simple code as I could work out.

In the end, I decided to stick to integer scaling factors and just center the image. So to take the above example, 1080/96 is 11.25, so I take samples that are 11 pixels apart in the original image, trimming the top/bottom borders a little bit (because of the truncation from 11.25 to 11) and the left/right borders a lot (because the buttons are square, and it’s better to crop the image than to letter-box it). What happens if you’ve got an image which is just white dots that are 11 pixels apart, and black everywhere else? You end up with a white image (assuming the dots are aligned with the sampling) – but in a camera image, that doesn’t really happen.

The maths ends up being slightly more fiddly when displaying a frame across several buttons. There are are gaps between the buttons, and while we could just ignore them, it looks very weird if you do – if a straight line crosses multiple buttons, it ends up looking “broken” due to the gap, for example. Instead, if we take the gaps into account as if we were drawing them, it looks fine. The arithmetic here isn’t actually hard in any sense of the word – but it still took me a few goes to get right.

Putting it together

Of course, Stream Deck buttons aren’t just screens: they’re pressable buttons as well. I haven’t gone to down on the user interface here: the left-most column just buttons just displays the NDI sources, and pressing one of those buttons displays that source on the rest of the buttons. That part was really simple – as you’d probably expect it to be.

The initial prototype took about two or three hours to write (bearing in mind I already had experience with both the NDI code and the Stream Deck SDK), and then it took another couple of hours to polish it up a bit and get it ready for publication. The application code is all available on my DemoCode GitHub repository; unfortunately even if you happen to have an NDI camera and a Stream Deck, you won’t be able to use it without my tweaks to the NDI C# code. (If the C# part of the NDI SDK is ever made open source, I’ll happily fork it and include my tweaks there.)

I’ve put a YouTube video of the results. Hope you enjoy them. I’ve had a lot of fun with this project, despite the lack of practical applications for it.

Diagnosing a VISCA camera issue

As I have mentioned before, I’ve been spending a lot of time over the last two years writing code for my local church’s A/V system. (Indeed, I’ve been giving quite a few user group talks recently about the fun I’ve had doing so.) That new A/V system is called “At Your Service”, or AYS for short. I only mention that because it’s simpler to refer to AYS for the rest of this post than “the A/V app”.

Our church now uses three cameras from PTZOptics. They’re all effectively the same model: 30x optical Zoom, Power over Ethernet, with NDI support (which I use for the actual video capture – more about that in a subsequent blog post). I control the cameras using VISCA over TCP/IP, as I’ve blogged about before. At home I have one PTZOptics camera (again, basically the same camera) and a Minrray UV5120A – also 30x optical zoom with NDI support.

Very occasionally, the cameras run into problems: sometimes the VISCA interface comes up, but there’s no NDI stream; sometimes the camera just doesn’t stop panning after I move it. In the early days, when I would only send a VISCA command when I wanted to actually do something, I believe the TCP/IP connection was closed automatically after being idle for an hour.

For these reasons, I now have two connections per camera:

  • One for the main control, which includes a “heartbeat” command of “get current pan/tilt/zoom” issued every three minutes.
  • One for frequent status checking, so that we can tell if the camera itself is online even if the main control connection ends up causing problems. This sends a “get power status” every 5 seconds.

If anything goes wrong, the user can remotely reboot the camera (which creates a whole new TCP/IP connection just in case the existing ones are broken; obviously this doesn’t help if the camera is completely failing in network terms).

This all works pretty well – but my logs sometimes show an error response from the camera – equivalent to an HTTP 400, basically saying “the VISCA command you sent has incorrect syntax”. Yesterday I decided to dedicate some time to working out what was going on, and that’s the topic of this blog post. The actual problem isn’t terribly important – I’d be surprised if more than a handful of readers (if any!) faced the same issue. But I’m always interested in the diagnostic process.

Hack AYS to add more stress

I started off by modifying AYS to make it send more commands to the camera, in two different ways:

  • I modified the frequency of the status check and heartbeat
  • I made each of those also send 100 commands instead of just one
    • First sending the 100 commands one at a time
    • Then changed to sending them as 100 tasks started at the same time and then awaited as a bunch

This increased the rate of error – but not in any nicely reproducible way.

Looking back, I probably shouldn’t have started here. AYS does a lot of other stuff, including quite a lot of initialization on startup (VLC, OBS, Zoom) which makes the feedback loop a lot slower when experimenting. I needed something that was dedicated to just provoking the problem.

Create a dedicated stress test app

It’s worth noting at this point that I’ve got a library (source here) that I’m using to handle the TCP connections and send the commands. This keeps all the knowledge of exactly how VISCA works away from AYS, and makes it reasonably easy to write test code separately from the app. However, it does mean that when something goes wrong, my first expectation is that this is a problem in the library. I always assume my own code is broken before placing the blame elsewhere… and usually that assumption is well-founded.

Despite the changes to AYS not provoking things as much as I’d expected, I still thought concurrency would be the key. How could we overload the camera?

I wrote a simple stress test app to send lots of simple “get power status” requests at the camera, from multiple tasks, and record the number of successful commands vs ones which failed for various different reasons (camera responded with an error; camera violated VISCA itself; command timed out). Initially, I found that some tasks had issued far more requests than others – this turned out to be due to the way that the thread pool (used by tasks in a console app) starts small and gradually expands. A significant chunk of the stress test app is given over to getting all the tasks “ready to go” and releasing them all at the same time.

The stress test app is configurable in a number of ways:

  • The camera IP address and VISCA port
  • Whether to use a single controller object (which means a single TCP connection) or one per task. (The library queues concurrent requests, so any given TCP connection only has a single active command at a time.)
  • How long each task should delay between requests
  • How long each command should wait before timing out
  • How long the test should last overall

At first, the results seemed all over the place. With a single controller, and enough of a delay (or few enough tasks) to avoid commands timing out due to the queuing, I received no errors. With multiple controllers, I saw all kinds of results – some tasks never managing a single request, others with just a few errors, and lots of timeouts.

Oh, and if I overwhelmed the camera too much, it would just reset itself during the test (which involves it tilting up to the ceiling then back down to horizontal). Not quite “halt and catch fire”, but a very physically visible indication of an error. I’m pretty confident I haven’t actually damaged the camera though, and it seems fairly reasonable for it to reset itself in the face of a sort of DoS attack like this stress test.

However, I did spot that I never had a completely clean test with more than one task. I wondered: how low could I take the load and still see problems?

Even with just two tasks, and a half second delay between attempts, I’d reliably see one task have a single error response, and the other task have a command timeout. Aha – we’re getting somewhere.

On a hunch (so often the case with diagnostics) I added console output in the catch blocks to include the time at which the exception was thrown. As I’d started to suspect, it was the very first command that failed, and it failed for both tasks. Now we’re getting somewhere.

What’s special about the first command? We’ve carefully set the system up to start all the tasks sending commands at exactly the same time (as near as the scheduler will allow, anyway) – they may well get out of sync after the first command, as different responses take slightly different lengths of time to come back, but the first commands should be sent pretty much simultaneously.

At this point, I broke out Wireshark – an excellent network protocol analyzer, allowing me to see individual TCP packets. Aside from anything else, this could help to rule out client-side issues: if the TCP packets I sent looked correct, the code sending them was irrelevant.

Sure enough, I saw:

  • Two connections being established
  • The same 5 bytes (the VISCA command: 81 09 04 00 ff) being sent on each connection in two packets about 20 microseconds apart.
  • A 4 byte response (a VISCA error: 90 60 02 ff) being sent down the first connection 10ms later
  • No data being sent down the second connection

That explained the “error on one, timeout on the other” behaviour I’d observed at the client side.

Test the other camera

Now that I could reliably reproduce the bug, I wondered – what does the Minrray camera do?

I expected it to have the same problem. I’m aware that there are a number of makes of camera that use very similar hardware – PTZOptics, Minrray, SMTAV, Zowietek for example. While they all have slightly different firmware and user interfaces, I expected that the core functionality of the camera would be common code.

I was wrong I have yet to reproduce the issue with the Minrray camera – even throwing 20 tasks at it, with only a millisecond delay between commands, I’ve seen no errors.

Report the bug

So, it looks like this may be a bug in the PTZOptics firmware. At first I was reluctant to go to the trouble of reporting the bug, given that it’s a real edge case. (I suspect relatively few people using these cameras connect more than one TCP stream to them over VISCA.) However, I received encouragement on Twitter, and I’ve had really good support experiences with PTZOptics, so I thought it worth having a go.

While my stress test app is much simpler than AYS, it’s definitely not a minimal example to demonstrate the problem. It’s 100 lines long and requires a separate library. Fortunately, all of the code for recording different kinds of failures, and starting tasks to loop for a while, etc – that’s all unnecessary when trying to just demonstrate the problem. Likewise I don’t need to worry about queuing commands on a single connection if I’m only sending a single command down each; I don’t need any of the abstraction that my library contains.

Instead, I boiled it down to this – 30 lines (of which several are comments or whitespace) that just sends two commands “nearly simultaneously” on separate connections and shows the response returned on the the first connection.

using System.Net.Sockets;

string host = "192.168.1.45";
int port = 5678;

byte[] getPowerCommand = { 0x81, 0x09, 0x04, 0x00, 0xff };

// Create two clients - these will connect immediately
var client1 = new TcpClient(host, port);
client1.NoDelay = true;
var stream1 = client1.GetStream();

var client2 = new TcpClient(host, port);
client2.NoDelay = true;
var stream2 = client2.GetStream();

// Write the "get power" command to both sockets as close to simultaneously as we can
stream1.Write(getPowerCommand);
stream2.Write(getPowerCommand);

// Read the response from the first client
var buffer = new byte[10];
int bytesRead = stream1.Read(buffer);
// Print it out in hex.
// This is an error: 90-60-02-FF
// This is success: 90-50-02-FF
Console.WriteLine(BitConverter.ToString(buffer[..bytesRead]));

// Note: this sample doesn't read from stream2, but basically when the bug strikes,
// there's nothing to read: the camera doesn't respond.

Simple but effectively – it reliably reproduces the error on the PTZOptics camera, and shows no problems on the Minrray.

I included that with the bug report, and have received a response from PTZOptics already, saying they’re looking into it. I don’t expect a new firmware version with a fix in any time soon – but I hope it might be in their next firmware update… and at least now I can test that easily.

Conclusion

This was classic diagnostic work:

  • Go from complex code to simple code
  • Try lots of configurations to try to make sense of random-looking data
  • Follow hunches and get more information
  • Use all the tools at your disposal (Wireshark in this case) to isolate the problem as far as possible
  • Once you understand the problem (even if you can’t fix it), write code designed specifically to reproduce it simply

Hope you found this as interesting as I did! Next (this weekend, hopefully): displaying the video output of these cameras on a Stream Deck…

What’s up with TimeZoneInfo on .NET 6? (Part 1)

.NET 6 was released in November 2021, and includes two new types which are of interest to date/time folks: DateOnly and TimeOnly. (Please don’t add comments saying you don’t like the names.) We want to support these types in Noda Time, with conversions between DateOnly and LocalDate, and TimeOnly and LocalTime. To do so, we’ll need a .NET-6-specific target.

Even as a starting point, this is slightly frustrating – we had conditional code differentiating between .NET Framework and PCLs for years, and we finally removed it in 2018. Now we’re having to reintroduce some. Never mind – it can’t be helped, and this is at least simple conditional code.

Targeting .NET 6 requires the .NET 6 SDK of course – upgrading to that was overdue anyway. That wasn’t particularly hard, although it revealed some additional nullable reference type warnings that needed fixing, almost all in tests (or in IComparable.Compare implementations).

Once everything was working locally, and I’d updated CI to use .NET 6 as well, I figured I’d be ready to start on the DateOnly and TimeOnly support. I was wrong. The pull request intending just to support .NET 6 with absolutely minimal changes failed its unit tests in CI running on Linux. There were 419 failures out of a total of 19334. Ouch! It looked like all of them were in BclDateTimeZoneTest – and fixing those issues is what this post is all about.

Yesterday (at the time of writing – by the time this post is finished it may be in the more distant past) I started trying to look into what was going on. After a little while, I decided that this would be worth blogging about – so most of this post is actually written as I discover more information. (I’m hoping that folks find my diagnostic process interesting, basically.)

Time zones in Noda Time and .NET

Let’s start with a bit of background about how time zones are represented in .NET and Noda Time.

In .NET, time zones are represented by the TimeZoneInfo class (ignoring the legacy TimeZone class). The data used to perform the underlying calculation of “what’s the UTC offset at a given instant in this time zone” are exposed via the GetAdjustmentRules() method, returning an array of the nested TimeZoneInfo.AdjustmentRule class. TimeZoneInfo instances are usually acquired via either TimeZoneInfo.FindSystemTimeZoneById(), TimeZoneInfo.GetSystemTimeZones(), or the TimeZoneInfo.Local static property. On Windows the information is populated from the Windows time zone database (which I believe is in the registry); on Linux it’s populated from files, typically in the /usr/share/zoneinfo directory. For example, the file /usr/share/zoneinfo/Europe/London file contains information about the time zone with the ID “Europe/London”.

In Noda Time, we separate time zones from their providers. There’s an abstract DateTimeZone class, with one public derived class (BclDateTimeZone) and various internal derived classes (FixedDateTimeZone, CachedDateTimeZone, PrecalculatedDateTimeZone) in the main NodaTime package. There are also two public implementations in the NodaTime.Testing package. Most code shouldn’t need to use anything other than DateTimeZone – the only reason BclDateTimeZone is public is to allow users to obtain the original TimeZoneInfo instance that any given BclDateTimeZone was created from.

Separately, there’s an IDateTimeZoneProvider interface. This only has a single implementation normally: DateTimeZoneCache. That cache makes that underlying provider code simpler, as it only has to implement IDateTimeZoneSource (which most users never need to touch). There are two implementations of IDateTimeZoneSource: BclDateTimeZoneSource and TzdbDateTimeZoneSource. The BCL source is for interop with .NET: it uses TimeZoneInfo as a data source, and basically adapts it into a Noda Time representation. The TZDB source implements the IANA time zone database – there’s a “default” set of data built into Noda Time, but you can also load specific data should you need to. (Noda Time uses the term “TZDB” everywhere for historical reasons – when the project started in 2009, IANA wasn’t involved at all. In retrospect, it would have been good to change the name immediately when IANA did get involved in 2011 – that was before the 1.0 release in 2012.)

This post is all about how BclDateTimeZone handles the adjustment rules in TimeZoneInfo. Unfortunately the details of TimeZoneInfo.AdjustmentRule have never been very clearly documented (although it’s better now – see later), and I’ve blogged before about their strange behaviour. The source code for BclDateTimeZone has quite a few comments explaining “unusual” code that basically tries to make up for this. Over the course of writing this post, I’ll be adding some more.

Announced TimeZoneInfo changes in .NET 6

I was already aware that there might be some trouble brewing in .NET 6 when it came to Noda Time, due to enhancements announced when .NET 6 was released. To be clear, I’m not complaining about these enhancements. They’re great for the vast majority of users: you can call TimeZoneInfo.FindSystemTimeZoneById with either an IANA time zone ID (e.g. “Europe/London”) or a Windows time zone ID (e.g. “GMT Standard Time” for the UK, even when it’s not on standard time) and it will return you the “right” time zone, converting the ID if necessary. I already knew I’d need to check what Noda Time was doing and exactly how .NET 6 behaved, to avoid problems.

I suspect that the subject of this post is actually caused by this change though:

Two other minor improvements were made to how adjustment rules are populated from IANA data internally on non-Windows operating systems. They don’t affect external behavior, other than to ensure correctness in some edge cases.

Ensure correctness, eh? They don’t affect external behavior? Hmm. Given what I’ve already seen, I’m pretty sure I’m going to disagree with that assessment. Still, let’s plough on.

Getting started

The test errors in CI (via GitHub actions) seemed to fall into two main buckets, on a very brief inspection:

  • Failure to convert a TimeZoneInfo into a BclDateTimeZone at all (BclDateTimeZone.FromTimeZoneInfo() throwing an exception)
  • Incorrect results when using a BclDateTimeZone that has been converted. (We validate that BclDateTimeZone gives the same UTC offsets as TimeZoneInfo around all the transitions that we’ve detected, and we check once a week for about 100 years as well, just in case we missed any transitions.)

The number of failures didn’t bother me – this is the sort of thing where a one-line change can fix hundreds of tests. But without being confident of where the problem was, I didn’t want to start a “debugging via CI” cycle – that’s just awful.

I do have a machine that can dual boot into Linux, but it’s only accessible when I’m in my shed (as opposed to my living room or kitchen), making it slightly less convenient for debugging than my laptop. But that’s not the only option – there’s WSL 2 which I hadn’t previously looked at. This seemed like the perfect opportunity.

Installing WSL 2 was a breeze, including getting the .NET 6 SDK installed. There’s one choice I’ve made which may or may not be the right one: I’ve cloned the Noda Time repo within Linux, so that when I’m running the tests there it’s as close to being on a “regular” Linux system as normal. I can still use Visual Studio to edit the files (via the WSL mount point of \\wsl.localhost), but it’ll be slightly fiddly to manage. The alternative would be to avoid cloning any of the source code within the Linux file system, instead running the tests from WSL against the source code on the Windows file system. I may change my mind over the best approach half way through…

First, the good news: running the tests against the netcoreapp3.1 target within WSL 2, everything passed first time. Hooray!

Now the bad news: I didn’t get the same errors in WSL 2 that I’d seen in CI. Instead of 419, there were 1688! Yikes. They were still all within BclDateTimeZoneTest though, so I didn’t investigate that discrepancy any further – it may well be a difference in terms of precise SDK versions, or Linux versions. We clearly want everything to work on WSL 2, so let’s get that working first and see what happens in CI. (Part of me does want to understand the differences, to avoid a situation where the tests could pass in CI but not in WSL 2. I may come back to that later, when I understand everything more.)

First issue: abutting maps

The first exception reported in WSL 2 – accounting for the majority of errors – was a conversion failure:

NodaTime.Utility.DebugPreconditionException : Maps must abut (parameter name: maps)

The “map” in question is a PartialZoneIntervalMap, which maps instants to offsets over some interval of time. A time zone (at least for BclDateTimeZone) is created from a sequence of PartialZoneIntervalMaps, where the end of map n is the start of map n+1. The sequence has to cover the whole of time.

As it happens, by the time I’m writing this, I know what the immediate problem is here (because I fixed it last night, before starting to write this blog post) but in the interests of simplicity I’m going to effectively ignore what I did last night, beyond this simplified list:

  • I filtered the tests down to a single time zone (to get a smaller log)
  • I added more information to the exception (showing the exact start/end that were expected to be the same)
  • I added Console.WriteLine logging to BclDateTimeZone construction to dump a view of the adjustment rules
  • I observed and worked around an oddity that we’ll look at shortly

Looking at this now, the fact that it’s a DebugPreconditionException makes me wonder whether this is the difference between CI and local failures: for CI, we run in release mode. Let’s try running the tests in release mode… and yes, we’re down to 419 failures, the same as for CI! That’s encouraging, although it suggests that I might want CI to run tests in debug as well as release mode – at least when the main branch has been updated.

Even before the above list of steps, it seemed likely that the problems would be due changes in the adjustment rule representation in TimeZoneInfo. So at this point, let’s take a steps back and look at what’s meant to be in an adjustment rule, and what we observe in both .NET Core 3.1 and .NET 6.

What’s in an AdjustmentRule?

An adjustment rule covers an interval of time, and describes how the time zone behaves during that interval. (A bit like the PartialZoneIntervalMap mentioned above.)

Let’s start with some good news: it looks like the documentation for TimeZoneInfo.AdjustmentRule has been improved since I last looked at it. It has 6 properties:

  • BaseUtcOffsetDelta: this is only present in .NET 6, and indicates the difference between “the UTC offset of Standard Time returned by TimeZoneInfo.BaseUtcOffset” and “the UTC offset of Standard Time when this adjustment rule is active”. Effectively this makes up for Windows time zones historically not being able to represent the concept of a zone’s standard time changing.
  • DateStart/DateEnd: the date interval during which the rule applies.
  • DaylightDelta: the delta between standard time and daylight time during this rule. This is typically one hour.
  • DaylightTransitionStart/DaylightTransitionEnd: the information about when the time zone starts and ends daylight saving time (DST) while this rule is in force.

Before we go into the details of DST, there are two “interesting” aspects to DateStart/DateEnd:

Firstly, the documentation doesn’t say whether the rule applies between those UTC dates, or those local dates. I believe they’re local – but that’s an awkard way of specifying things, as local date/time values can be skipped or ambiguous. I really wish this has been set to UTC, and documented as such. Additionally, although you’d expect the transition from one rule to the next to be at midnight (given that only the start/end are only dates), the comments in my existing BclDateTimeZone code suggest that it’s actually at a time of day that depends on the DST transitions times. (It’s very possible that my code is wrong, of course. We’ll look at that in a bit.)

Secondly, the documentation includes this interesting warning (with an example which I’ve snipped out):

Unless there is a compelling reason to do otherwise, you should define the adjustment rule’s start date to occur within the time interval during which the time zone observes standard time. Unless there is a compelling reason to do so, you should not define the adjustment rule’s start date to occur within the time interval during which the time zone observes daylight saving time.

Why? What is likely to go wrong if you violate this? This sort of “here be dragons, but only vaguely specified ones” documentation always feels unhelpful to me. (And yes, I’ve probably written things like that too…)

Anyway, let’s look at the TimeZoneInfo.TransitionTime struct, which is the type of DaylightTransitionStart and DaylightTransitionEnd. The intention is to be able to represent ideas like “3am on February 25th” or “2am on the third Sunday in October”. The first of these is a fixed date rule; the second is a floating date rule (because the day-of-month of “the third Sunday in October” depends on the year). TransitionTime is a struct with 6 properties:

  • IsFixedDateRule: true for fixed date rules; false for floating date rules
  • Day (only relevant for fixed date rules): the day-of-month on which the transition occurs
  • DayOfWeek (only relevant for floating date rules): the day-of-week on which the transition occurs
  • Week (only relevant for floating date rules): confusingly, this isn’t really “the week of the month” on which the transition occurs; it’s “the occurrence of DayOfWeek on which the transition occurs”. (The idea of a “Monday to Sunday” or “Sunday to Saturday” week is irrelevant here; it’s just “the first Sunday” or “the second Sunday” etc.) If this has a value of 5, it means “last” regardless of whether that’s the fourth or fifth occurrence.
  • Month the month of year in which the transition occurs
  • TimeOfDay: the local time of day prior to the transition, at which the transition occurs. (So for a transition that skips forward from 1am to 2am for example, this would be 1am. For a transition that skips back from 2am to 1am, this would be 2am.)

Let’s look at the data

From here on, I’m writing and debugging at the same time – any stupid mistakes I make along the way will be documented. (I may go back to indicate that it turned out an idea was stupid at the start of that idea, just to avoid anyone else following it.)

Rather than trying to get bogged down in what the existing Noda Time implementation does, I think it would be useful to compare the data for the same time zone in Windows and Linux, .NET Core 3.1 and .NET 6.

Aha! It looks like I’ve had this idea before! The tool already exists as NodaTime.Tools.DumpTimeZoneInfo. I just need to target it for .NET 6 as well, and add the .NET-6-only BaseUtcOffsetDelta property the completeness.

Interlude: WSL 2 root file issues

Urgh. For some reason, something (I suspect it’s Visual Studio or a background process launched by it, but I’m not sure) keeps on creating files (or modifying existing files) so they’re owned by the root user on the Linux file system. Rather than spending ages investigating this, I’m just going to switch to the alternative mode: use my existing git repo on the Windows file system, and run the code that’s there from WSL when I need to.

(I’m sure this is all configurable and feasible; I just don’t have the energy right now.)

Back to the data…

I’m going to use London as my test time zone, mostly because that’s the time zone I live in, but also because I know it has an interesting oddity between 1968 and 1971, where the UK was on “British Standard Time” – an offset of UTC+1, like “British Summer Time” usually is, but this was “permanent standard time”. In other words, for a few years, our standard UTC offset changed. I’m expecting that to show up in the BaseUtcOffsetDelta property.

So, let’s dump some of the data for the Europe/London time zone, with both .NET Core 3.1 and .NET 6. The full data is very long (due to how the data is represented in the IANA binary format) but here are interesting portions of it, including the start, the British Standard Time experiment, this year (2022) and the last few lines:

.NET Core 3.1:

Zone ID: Europe/London
Display name: (UTC+00:00) GMT
Standard name: GMT
Daylight name: GMT+01:00
Base offset: 00:00:00
Supports DST: True
Rules:
0001-01-01 - 1847-12-01: Daylight delta: +00; DST starts January 01 at 00:00:00 and ends December 01 at 00:01:14
1847-12-01 - 1916-05-21: Daylight delta: +00; DST starts December 01 at 00:01:15 and ends May 21 at 01:59:59
1916-05-21 - 1916-10-01: Daylight delta: +01; DST starts May 21 at 02:00:00 and ends October 01 at 02:59:59
1916-10-01 - 1917-04-08: Daylight delta: +00; DST starts October 01 at 02:00:00 and ends April 08 at 01:59:59
...
1967-03-19 - 1967-10-29: Daylight delta: +01; DST starts March 19 at 02:00:00 and ends October 29 at 02:59:59
1967-10-29 - 1968-02-18: Daylight delta: +00; DST starts October 29 at 02:00:00 and ends February 18 at 01:59:59
1968-02-18 - 1968-10-26: Daylight delta: +01; DST starts February 18 at 02:00:00 and ends October 26 at 23:59:59
1968-10-26 - 1971-10-31: Daylight delta: +00; DST starts October 26 at 23:00:00 and ends October 31 at 01:59:59
1971-10-31 - 1972-03-19: Daylight delta: +00; DST starts October 31 at 02:00:00 and ends March 19 at 01:59:59
1972-03-19 - 1972-10-29: Daylight delta: +01; DST starts March 19 at 02:00:00 and ends October 29 at 02:59:59
1972-10-29 - 1973-03-18: Daylight delta: +00; DST starts October 29 at 02:00:00 and ends March 18 at 01:59:59
...
2022-03-27 - 2022-10-30: Daylight delta: +01; DST starts March 27 at 01:00:00 and ends October 30 at 01:59:59
2022-10-30 - 2023-03-26: Daylight delta: +00; DST starts October 30 at 01:00:00 and ends March 26 at 00:59:59
...
2036-03-30 - 2036-10-26: Daylight delta: +01; DST starts March 30 at 01:00:00 and ends October 26 at 01:59:59
2036-10-26 - 2037-03-29: Daylight delta: +00; DST starts October 26 at 01:00:00 and ends March 29 at 00:59:59
2037-03-29 - 2037-10-25: Daylight delta: +01; DST starts March 29 at 01:00:00 and ends October 25 at 01:59:59
2037-10-25 - 9999-12-31: Daylight delta: +01; DST starts October 25 at 01:00:00 and ends December 31 at 23:59:59

.NET 6:

Zone ID: Europe/London
Display name: (UTC+00:00) United Kingdom Time
Standard name: Greenwich Mean Time
Daylight name: British Summer Time
Base offset: 00:00:00
Supports DST: True
Rules:
0001-01-01 - 0001-12-31: Base UTC offset delta: -00:01; Daylight delta: +00; DST starts January 01 at 00:00:00 and ends December 31 at 23:59:59.999
0002-01-01 - 1846-12-31: Base UTC offset delta: -00:01; Daylight delta: +00; DST starts January 01 at 00:00:00 and ends December 31 at 23:59:59.999
1847-01-01 - 1847-12-01: Base UTC offset delta: -00:01; Daylight delta: +00; DST starts January 01 at 00:00:00 and ends December 01 at 00:01:14.999
1916-05-21 - 1916-10-01: Daylight delta: +01; DST starts May 21 at 02:00:00 and ends October 01 at 02:59:59.999
1917-04-08 - 1917-09-17: Daylight delta: +01; DST starts April 08 at 02:00:00 and ends September 17 at 02:59:59.999
1918-03-24 - 1918-09-30: Daylight delta: +01; DST starts March 24 at 02:00:00 and ends September 30 at 02:59:59.999
...
1967-03-19 - 1967-10-29: Daylight delta: +01; DST starts March 19 at 02:00:00 and ends October 29 at 02:59:59.999
1968-02-18 - 1968-10-26: Daylight delta: +01; DST starts February 18 at 02:00:00 and ends October 26 at 23:59:59.999
1968-10-26 - 1968-12-31: Base UTC offset delta: +01; Daylight delta: +00; DST starts October 26 at 23:00:00 and ends December 31 at 23:59:59.999
1969-01-01 - 1970-12-31: Base UTC offset delta: +01; Daylight delta: +00; DST starts January 01 at 00:00:00 and ends December 31 at 23:59:59.999
1971-01-01 - 1971-10-31: Base UTC offset delta: +01; Daylight delta: +00; DST starts January 01 at 00:00:00 and ends October 31 at 01:59:59.999
1972-03-19 - 1972-10-29: Daylight delta: +01; DST starts March 19 at 02:00:00 and ends October 29 at 02:59:59.999
1973-03-18 - 1973-10-28: Daylight delta: +01; DST starts March 18 at 02:00:00 and ends October 28 at 02:59:59.999
...
2022-03-27 - 2022-10-30: Daylight delta: +01; DST starts March 27 at 01:00:00 and ends October 30 at 01:59:59.999
...
2037-03-29 - 2037-10-25: Daylight delta: +01; DST starts March 29 at 01:00:00 and ends October 25 at 01:59:59.999
2037-10-25 - 9999-12-31: Daylight delta: +01; DST starts Last Sunday of March; 01:00:00 and ends Last Sunday of October; 02:00:00

Wow… that’s quite a difference. Let’s see:

  • The names (display/standard/daylight) are all different – definitely better in .NET 6.
  • .NET 6 appears to have one rule for the year 1, and then another (but identical) for years 2 to 1846
  • .NET 6 doesn’t have any rules between 1847 and 1916
  • .NET 6 only uses one rule per year, starting and ending at the DST boundaries; .NET Core 3.1 had one rule for each transition
  • The .NET Core 3.1 rules end at 59 minutes past the hour (e.g. 01:59:59) whereas the .NET 6 rules finish 999 milliseconds later

Fixing the code

So my task is to “interpret” all of this rule data in Noda Time, bearing in mind that:

  • It needs to work with Windows data as well (which has its own quirks)
  • It probably shouldn’t change logic based on which target framework it was built against, as I suspect it’s entirely possible
    for the DLL targeting .NET Standard 2.0 to end up running in .NET 6.

We do already have code that behaves differently based on whether it believes
the rule data comes from Windows or Unix – Windows rules always start on January 1st and end on December 31st, so if all
the rules in a zone follow that pattern, we assume we’re dealing with Windows data. That makes it slightly easier.

Likewise, we already have code that assumes any gaps between rules are in standard time – so actually the fact that .NET 6 only reports half as many rules probably won’t cause a problem.

Let’s start by handling the difference of transitions finishing at x:59:59 vs x:59:59.999. The existing code always adds 1 second to the end time, to account for x:59:59. It’s easy enough to adjust that to add either 1 second or 1 millisecond. This error was what caused our maps to have problems, I suspect. (We’d have a very weird situation in a few cases where one map started after the previous one ended.)

// This is added to the declared end time, so that it becomes an exclusive upper bound.
var endTimeCompensation = Duration.FromSeconds(1) - Duration.FromMilliseconds(bclLocalEnd.Millisecond);

Let’s try it: dotnet test -f net6.0

Good grief. Everything passed. Better try it with 3.1 as well: dotnet test -f netcoreapp3.1

Yup, everything passed there, too. And on Windows, although that didn’t surprise me much, given that we have separate paths.

This surprises me for two reasons:

  • Last night, when just experimenting, I made a change to just subtract bclLocalEnd.Millisecond milliseconds from bclLocalEnd (i.e. truncate it down). That helped a lot, but didn’t fix everything.
  • The data has changed really quite substantially, so I’m surprised that there aren’t extra issues. Do we get the “standard offset” correct during the British Standard Time experiment, for example?

I’m somewhat suspicious of the first bullet point… so I’m going to stash the fix, and try to reproduce last night.

Testing an earlier partial fix (or not…)

First, I remember that I did something I definitely wanted to keep last night. When adjacent maps don’t abut, let’s throw a better exception.

So before I do anything else, let’s reproduce the original errors: dotnet test -f net6.0

Ah. It still passes. Doh! When I thought I was running the .NET 6 tests under Linux, it turned out I was still in a Windows tab in Windows Terminal. (I use bash in all my terminals, so there’s not quite as much distinction as you might expect.) Well, that at least explains why the small fix worked rather better than expected. Sigh.

Okay, let’s rerun the tests… and they fail as expected. Now let’s add more details to the exception before reapplying the fix… done.

The resulting exception is clearer, and makes it obvious that the error is due to the 999ms discrepancy:

NodaTime.Utility.DebugPreconditionException : Maps must abut: 0002-01-01T00:00:00.999 != 0002-01-01T00:00:00

Let’s reapply the fix from earlier, which we expect to solve that problem but not everything. Retest… and we’re down to 109 failures rather than 1688. Much better, but not great.

Let’s understand one new error

We’re still getting errors of non-abutting maps, but now they’re (mostly) an hour out, rather than 999ms. Here’s one from Europe/Prague:

NodaTime.Utility.DebugPreconditionException : Maps must abut: 1947-01-01T00:00:00 != 1946-12-31T23:00:00

Most errors are in the 20th century, although there are some in 2038 and 2088, which is odd. Let’s have a look at the raw data for Prague around the time that’s causing problems, and we can see whether fixing just Prague helps with anything else.

.NET 6 data:

1944-04-03 - 1944-10-02: Daylight delta: +01; DST starts April 03 at 02:00:00 and ends October 02 at 02:59:59.999
1945-04-02 - 1945-05-08: Daylight delta: +01; DST starts April 02 at 02:00:00 and ends May 08 at 23:59:59.999
1945-05-08 - 1945-10-01: Daylight delta: +01; DST starts May 08 at 23:00:00 and ends October 01 at 02:59:59.999
1946-05-06 - 1946-10-06: Daylight delta: +01; DST starts May 06 at 02:00:00 and ends October 06 at 02:59:59.999
1946-12-01 - 1946-12-31: Daylight delta: -01; DST starts December 01 at 03:00:00 and ends December 31 at 23:59:59.999
1947-01-01 - 1947-02-23: Daylight delta: -01; DST starts January 01 at 00:00:00 and ends February 23 at 01:59:59.999
1947-04-20 - 1947-10-05: Daylight delta: +01; DST starts April 20 at 02:00:00 and ends October 05 at 02:59:59.999
1948-04-18 - 1948-10-03: Daylight delta: +01; DST starts April 18 at 02:00:00 and ends October 03 at 02:59:59.999
1949-04-09 - 1949-10-02: Daylight delta: +01; DST starts April 09 at 02:00:00 and ends October 02 at 02:59:59.999
1979-04-01 - 1979-09-30: Daylight delta: +01; DST starts April 01 at 02:00:00 and ends September 30 at 02:59:59.999

This is interesting – most years have just one rule, but the three years of 1945-1947 have two rules each.

Let’s look at the .NET Core 3.1 representation – which comes from the same underlying file, as far as I’m aware:

1944-10-02 - 1945-04-02: Daylight delta: +00; DST starts October 02 at 02:00:00 and ends April 02 at 01:59:59
1945-04-02 - 1945-05-08: Daylight delta: +01; DST starts April 02 at 02:00:00 and ends May 08 at 23:59:59
1945-05-08 - 1945-10-01: Daylight delta: +01; DST starts May 08 at 23:00:00 and ends October 01 at 02:59:59
1945-10-01 - 1946-05-06: Daylight delta: +00; DST starts October 01 at 02:00:00 and ends May 06 at 01:59:59
1946-05-06 - 1946-10-06: Daylight delta: +01; DST starts May 06 at 02:00:00 and ends October 06 at 02:59:59
1946-10-06 - 1946-12-01: Daylight delta: +00; DST starts October 06 at 02:00:00 and ends December 01 at 02:59:59
1946-12-01 - 1947-02-23: Daylight delta: -01; DST starts December 01 at 03:00:00 and ends February 23 at 01:59:59
1947-02-23 - 1947-04-20: Daylight delta: +00; DST starts February 23 at 03:00:00 and ends April 20 at 01:59:59
1947-04-20 - 1947-10-05: Daylight delta: +01; DST starts April 20 at 02:00:00 and ends October 05 at 02:59:59
1947-10-05 - 1948-04-18: Daylight delta: +00; DST starts October 05 at 02:00:00 and ends April 18 at 01:59:59
1948-04-18 - 1948-10-03: Daylight delta: +01; DST starts April 18 at 02:00:00 and ends October 03 at 02:59:59
1948-10-03 - 1949-04-09: Daylight delta: +00; DST starts October 03 at 02:00:00 and ends April 09 at 01:59:59
1949-04-09 - 1949-10-02: Daylight delta: +01; DST starts April 09 at 02:00:00 and ends October 02 at 02:59:59
1949-10-02 - 1978-12-31: Daylight delta: +00; DST starts October 02 at 02:00:00 and ends December 31 at 23:59:59
1979-01-01 - 1979-04-01: Daylight delta: +00; DST starts January 01 at 00:00:00 and ends April 01 at 01:59:59

Okay, so that makes a certain amount of sense – it definitely shows that there was something unusual happening in the Europe/Prague time zone. Just as one extra point of data, let’s look at the nodatime.org tzvalidate results – this shows all transitions. (tzvalidate is a format designed to allow authors of time zone library code to validate that they’re interpreting the IANA data the same way as each other.)

Europe/Prague
Initially:           +01:00:00 standard CET
1944-04-03 01:00:00Z +02:00:00 daylight CEST
1944-10-02 01:00:00Z +01:00:00 standard CET
1945-04-02 01:00:00Z +02:00:00 daylight CEST
1945-10-01 01:00:00Z +01:00:00 standard CET
1946-05-06 01:00:00Z +02:00:00 daylight CEST
1946-10-06 01:00:00Z +01:00:00 standard CET
1946-12-01 02:00:00Z +00:00:00 daylight GMT
1947-02-23 02:00:00Z +01:00:00 standard CET
1947-04-20 01:00:00Z +02:00:00 daylight CEST
1947-10-05 01:00:00Z +01:00:00 standard CET
1948-04-18 01:00:00Z +02:00:00 daylight CEST
1948-10-03 01:00:00Z +01:00:00 standard CET
1949-04-09 01:00:00Z +02:00:00 daylight CEST
1949-10-02 01:00:00Z +01:00:00 standard CET

Again there’s that odd period from December 1946 to near the end of February 1947 where there’s daylight savings of -1 hour. I’m not interested in the history of that right now – I’m interested in why the code is failing.

In this particular case, it looks like the problem is we’ve got two adjacent rules in .NET 6 (one at the end of 1946 and the other at the start of 1947) which both just describe periods of daylight saving.

If we can construct the maps to give the right results, Noda Time already has code in to work out “that’s okay, there’s no transition at the end of 1946”. But we need to get the maps right to start with.

Unfortunately, BclDateTimeZone already has complicated code to handle the previously-known corner cases. That makes the whole thing feel quite precarious – I could easily end up breaking other things by trying to fix this one specific aspect. Still, that’s what unit tests are for.

Looking at the code, I suspect the problem is with the start time of the first rule of 1947, which I’d expect to start at 1947-01-01T00:00:00Z, but is actually deemed to start at 1946-12-31T23:00:00Z. (In the course of writing that out, I notice that my improved-abutting-error exception doesn’t include the “Z”. Fix that now…)

Ah… but the UTC start of the rule is currently expected to be “the start date + the transition start time – base UTC offset”. That does give 1946-12-31T23:00:00Z. We want to apply the daylight savings (of -1 hour) in this case, because the start of the rule is during daylight savings. Again, there’s no documentation to say exactly what is meant by “start date” for the rule, and hopefully you can see why it’s really frustrating to have to try to reverse-engineer this in a version-agnostic way. Hmm.

Seeking an unambiguous and independent interpretation of AdjustmentRule

It’s relatively easy to avoid the “maps don’t abut” issue if we don’t care about really doing the job properly. After converting each AdjustmentRule to its Noda Time equivalent, we can look at rule pair of adjacent rules in the sequence: if the start of the “next” rule is earlier than the end of the “previous” rule, we can just adjust the start point. But that’s really just brushing the issue under the carpet – and as it happens, it just moves the exception to a different point.

That approach also requires knowledge of surrounding adjustment rules in order to completely understand one adjustment rule. That really doesn’t feel right to me. We should be able to understand the adjustment rule purely from the data exposed by that rule and the properties for the TimeZoneInfo itself. The code is already slightly grubby by calling TimeZoneInfo.IsDaylightSavingTime(). If I could work out how to remove that call too, that would be great. (It may prove infeasible to remove it for .NET Core 3.1, but feasible in 6. That’s not too bad. Interesting question: if the “grubby” code still works in .NET 6, is it better to use conditional code so that only the “clean” code is used in .NET 6, or avoid the conditional code? Hmm. We’ll see.)

Given that the rules in both .NET Core 3.1 and .NET 6 effectively mean that the start and end points are exactly the start and end points of DST (or other) transitions, I should be able to gather a number of examples of source data and expected results, and try to work out rules from that. In particular, this source data should include:

  • “Simple” situations (partly as a warm-up…)
  • Negative standard time offset (e.g. US time zones)
  • Negative savings (e.g. Prague above, and Europe/Dublin from 1971 onwards)
  • DST periods that cross year boundaries (primarily the southern hemisphere, e.g. America/Sao_Paulo)
  • Zero savings, but still in DST (Europe/Dublin before 1968)
  • Standard UTC offset changes (e.g. Europe/London 1968-1971, Europe/Moscow from March 2011 to October 2014)
  • All of the above for both .NET Core 3.1 and .NET 6, including the rules which represent standard time in .NET Core 3.1 but which are omitted in .NET 6

It looks like daylight periods which cross year boundaries are represented as single rules in .NET Core 3.1 and dual rules in .NET 6, so we’ll need to take that into account. In those cases we’ll need to map to two Noda Time rules, and we don’t mind where the transition between them is, so long as they abut. In general, working out the zone intervals that are relevant for a single year may require multiple lines of data from each source. (But we must be able to infer some of that from gaps, and other parts from individual source rules.)

Fortunately we’re not trying to construct “full rules” within Noda Time – just ZoneInterval values, effectively. All we need to be able to determine is:

  • Start instant
  • End instant
  • Standard offset
  • Daylight savings (if any)

When gathering the data, I’m going to assume that using the existing Noda Time interpretation of the IANA data is okay. That could be dangerous if either .NET interprets the data incorrectly, or if the Linux data isn’t the same as the IANA 2021e data I’m working from. There are ways to mitigate those risks, but they would be longwinded and I don’t think the risk justifies the extra work.

What’s absolutely vital is that the data is gathered carefully. If I mess this up (looking at the wrong time zone, or the wrong year, or running some code on Windows that I meant to run on Linux – like the earlier tests) it could several hours of work. This will be tedious.

Let’s gather some data…

Europe/Paris in 2020:
.NET Core 3.1:
Base offset = 1
2019-10-27 - 2020-03-29: Daylight delta: +00; DST starts October 27 at 02:00:00 and ends March 29 at 01:59:59
2020-03-29 - 2020-10-25: Daylight delta: +01; DST starts March 29 at 02:00:00 and ends October 25 at 02:59:59
2020-10-25 - 2021-03-28: Daylight delta: +00; DST starts October 25 at 02:00:00 and ends March 28 at 01:59:59

.NET 6:
Base offset = 1
2019-03-31 - 2019-10-27: Daylight delta: +01; DST starts March 31 at 02:00:00 and ends October 27 at 02:59:59.999
2020-03-29 - 2020-10-25: Daylight delta: +01; DST starts March 29 at 02:00:00 and ends October 25 at 02:59:59.999
2021-03-28 - 2021-10-31: Daylight delta: +01; DST starts March 28 at 02:00:00 and ends October 31 at 02:59:59.999

Noda Time zone intervals (start - end, standard, savings):
2019-10-27T01:00:00Z - 2020-03-29T01:00:00Z, +1, +0
2020-03-29T01:00:00Z - 2020-10-25T01:00:00Z, +1, +1
2020-10-25T01:00:00Z - 2021-03-28T01:00:00Z, +1, +0


America/Los_Angeles in 2020:

.NET Core 3.1:
Base offset = -8
2019-11-03 - 2020-03-08: Daylight delta: +00; DST starts November 03 at 01:00:00 and ends March 08 at 01:59:59
2020-03-08 - 2020-11-01: Daylight delta: +01; DST starts March 08 at 02:00:00 and ends November 01 at 01:59:59
2020-11-01 - 2021-03-14: Daylight delta: +00; DST starts November 01 at 01:00:00 and ends March 14 at 01:59:59

.NET 6:
Base offset = -8
2019-03-10 - 2019-11-03: Daylight delta: +01; DST starts March 10 at 02:00:00 and ends November 03 at 01:59:59.999
2020-03-08 - 2020-11-01: Daylight delta: +01; DST starts March 08 at 02:00:00 and ends November 01 at 01:59:59.999
2021-03-14 - 2021-11-07: Daylight delta: +01; DST starts March 14 at 02:00:00 and ends November 07 at 01:59:59.999

Noda Time zone intervals:
2019-11-03T09:00:00Z - 2020-03-08T10:00:00Z, -8, +0
2020-03-08T10:00:00Z - 2020-11-01T09:00:00Z, -8, +1
2020-11-01T09:00:00Z - 2021-03-14T10:00:00Z, -8, +0


Europe/Prague in 1946/1947:

.NET Core 3.1:
Base offset = 1
1945-10-01 - 1946-05-06: Daylight delta: +00; DST starts October 01 at 02:00:00 and ends May 06 at 01:59:59
1946-05-06 - 1946-10-06: Daylight delta: +01; DST starts May 06 at 02:00:00 and ends October 06 at 02:59:59
1946-10-06 - 1946-12-01: Daylight delta: +00; DST starts October 06 at 02:00:00 and ends December 01 at 02:59:59
1946-12-01 - 1947-02-23: Daylight delta: -01; DST starts December 01 at 03:00:00 and ends February 23 at 01:59:59
1947-02-23 - 1947-04-20: Daylight delta: +00; DST starts February 23 at 03:00:00 and ends April 20 at 01:59:59
1947-04-20 - 1947-10-05: Daylight delta: +01; DST starts April 20 at 02:00:00 and ends October 05 at 02:59:59
1947-10-05 - 1948-04-18: Daylight delta: +00; DST starts October 05 at 02:00:00 and ends April 18 at 01:59:59
1948-04-18 - 1948-10-03: Daylight delta: +01; DST starts April 18 at 02:00:00 and ends October 03 at 02:59:59

.NET 6:
Base offset = 1
1945-05-08 - 1945-10-01: Daylight delta: +01; DST starts May 08 at 23:00:00 and ends October 01 at 02:59:59.999
1946-05-06 - 1946-10-06: Daylight delta: +01; DST starts May 06 at 02:00:00 and ends October 06 at 02:59:59.999
1946-12-01 - 1946-12-31: Daylight delta: -01; DST starts December 01 at 03:00:00 and ends December 31 at 23:59:59.999
1947-01-01 - 1947-02-23: Daylight delta: -01; DST starts January 01 at 00:00:00 and ends February 23 at 01:59:59.999
1947-04-20 - 1947-10-05: Daylight delta: +01; DST starts April 20 at 02:00:00 and ends October 05 at 02:59:59.999
1948-04-18 - 1948-10-03: Daylight delta: +01; DST starts April 18 at 02:00:00 and ends October 03 at 02:59:59.999

Noda Time zone intervals:
1945-10-01T01:00:00Z - 1946-05-06T01:00:00Z, +1, +0
1946-05-06T01:00:00Z - 1946-10-06T01:00:00Z, +1, +1
1946-10-06T01:00:00Z - 1946-12-01T02:00:00Z, +1, +0
1946-12-01T02:00:00Z - 1947-02-23T02:00:00Z, +1, -1
1947-02-23T02:00:00Z - 1947-04-20T01:00:00Z, +1, +0
1947-04-20T01:00:00Z - 1947-10-05T01:00:00Z, +1, +1
1947-10-05T01:00:00Z - 1948-04-18T01:00:00Z, +1, +0


Europe/Dublin in 2020:

.NET Core 3.1:
Base offset = 1
2019-10-27 - 2020-03-29: Daylight delta: -01; DST starts October 27 at 02:00:00 and ends March 29 at 00:59:59
2020-03-29 - 2020-10-25: Daylight delta: +00; DST starts March 29 at 02:00:00 and ends October 25 at 01:59:59
2020-10-25 - 2021-03-28: Daylight delta: -01; DST starts October 25 at 02:00:00 and ends March 28 at 00:59:59

.NET 6.0:
Base offset = 1
2019-10-27 - 2019-12-31: Daylight delta: -01; DST starts October 27 at 02:00:00 and ends December 31 at 23:59:59.999
2020-01-01 - 2020-03-29: Daylight delta: -01; DST starts January 01 at 00:00:00 and ends March 29 at 00:59:59.999
2020-10-25 - 2020-12-31: Daylight delta: -01; DST starts October 25 at 02:00:00 and ends December 31 at 23:59:59.999
2021-01-01 - 2021-03-28: Daylight delta: -01; DST starts January 01 at 00:00:00 and ends March 28 at 00:59:59.999

Noda Time zone intervals:
2019-10-27T01:00:00Z - 2020-03-29T01:00:00Z, +1, -1
2020-03-29T01:00:00Z - 2020-10-25T01:00:00Z, +1, +0
2020-10-25T01:00:00Z - 2021-03-28T01:00:00Z, +1, -1


Europe/Dublin in 1960:

.NET Core 3.1:
Base offset = 1
1959-10-04 - 1960-04-10: Daylight delta: +00; DST starts October 04 at 03:00:00 and ends April 10 at 02:59:59
1960-04-10 - 1960-10-02: Daylight delta: +00; DST starts April 10 at 03:00:00 and ends October 02 at 02:59:59

.NET 6.0:
Base offset = 1
1959-10-04 - 1959-12-31: Base UTC offset delta: -01; Daylight delta: +00; DST starts October 04 at 03:00:00 and ends December 31 at 23:59:59.999
1960-01-01 - 1960-04-10: Base UTC offset delta: -01; Daylight delta: +00; DST starts January 01 at 00:00:00 and ends April 10 at 02:59:59.999
1960-04-10 - 1960-10-02: Daylight delta: +00; DST starts April 10 at 03:00:00 and ends October 02 at 02:59:59.999
1960-10-02 - 1960-12-31: Base UTC offset delta: -01; Daylight delta: +00; DST starts October 02 at 03:00:00 and ends December 31 at 23:59:59.999
1961-01-01 - 1961-03-26: Base UTC offset delta: -01; Daylight delta: +00; DST starts January 01 at 00:00:00 and ends March 26 at 02:59:59.999

Noda Time zone intervals:
1959-10-04T02:00:00Z - 1960-04-10T02:00:00Z, +0, +0
1960-04-10T02:00:00Z - 1960-10-02T02:00:00Z, +0, +1
1960-10-02T02:00:00Z - 1961-03-26T02:00:00Z, +0, +0


America/Sao_Paulo in 2018 (not 2020, as Brazil stopped observing daylight savings in 2019):

.NET Core 3.1:
Base offset = -3
2017-10-15 - 2018-02-17: Daylight delta: +01; DST starts October 15 at 00:00:00 and ends February 17 at 23:59:59
2018-02-17 - 2018-11-03: Daylight delta: +00; DST starts February 17 at 23:00:00 and ends November 03 at 23:59:59
2018-11-04 - 2019-02-16: Daylight delta: +01; DST starts November 04 at 00:00:00 and ends February 16 at 23:59:59

.NET 6.0:
Base offset = -3
2017-10-15 - 2017-12-31: Daylight delta: +01; DST starts October 15 at 00:00:00 and ends December 31 at 23:59:59.999
2018-01-01 - 2018-02-17: Daylight delta: +01; DST starts January 01 at 00:00:00 and ends February 17 at 23:59:59.999
2018-11-04 - 2018-12-31: Daylight delta: +01; DST starts November 04 at 00:00:00 and ends December 31 at 23:59:59.999
2019-01-01 - 2019-02-16: Daylight delta: +01; DST starts January 01 at 00:00:00 and ends February 16 at 23:59:59.999

Noda Time zone intervals:
2017-10-15T03:00:00Z - 2018-02-18T02:00:00Z, -3, +1
2018-02-18T02:00:00Z - 2018-11-04T03:00:00Z, -3, +0
2018-11-04T03:00:00Z - 2019-02-17T02:00:00Z, -3, +1


Europe/London in 1968-1971

.NET Core 3.1:
Base offset = 0
1968-10-26 - 1971-10-31: Daylight delta: +00; DST starts October 26 at 23:00:00 and ends October 31 at 01:59:59

.NET 6:
Base offset = 0
1968-10-26 - 1968-12-31: Base UTC offset delta: +01; Daylight delta: +00; DST starts October 26 at 23:00:00 and ends December 31 at 23:59:59.999
1969-01-01 - 1970-12-31: Base UTC offset delta: +01; Daylight delta: +00; DST starts January 01 at 00:00:00 and ends December 31 at 23:59:59.999
1971-01-01 - 1971-10-31: Base UTC offset delta: +01; Daylight delta: +00; DST starts January 01 at 00:00:00 and ends October 31 at 01:59:59.999

Noda Time zone intervals:
1968-10-26T23:00:00Z - 1971-10-31T02:00:00Z, +1, +0


Europe/Moscow in 2011-2014

.NET Core 3.1:
Base offset = 3
2011-03-27 - 2014-10-26: Daylight delta: +00; DST starts March 27 at 02:00:00 and ends October 26 at 00:59:59

.NET 6:
Base offset = 3
2011-03-27 - 2011-12-31: Base UTC offset delta: +01; Daylight delta: +00; DST starts March 27 at 02:00:00 and ends December 31 at 23:59:59.999
2012-01-01 - 2013-12-31: Base UTC offset delta: +01; Daylight delta: +00; DST starts January 01 at 00:00:00 and ends December 31 at 23:59:59.999
2014-01-01 - 2014-10-26: Base UTC offset delta: +01; Daylight delta: +00; DST starts January 01 at 00:00:00 and ends October 26 at 00:59:59.999

Noda Time zone intervals:
2011-03-26T23:00:00Z - 2014-10-25T22:00:00Z, +4, +0

I think that forcing myself to collect these small bits of data and write them down will be a bit of a game-changer. Previously I’ve taken handwritten notes for individual issues, relying on the “global” unit tests (check every transition in every time zone) to catch any problems after I’d implemented them. But with the data above, I can write unit tests. And those unit tests don’t need to depend on whether we’re running on Windows and Linux, which will make the whole thing much simpler. We’re not testing an actual time zone – we’re testing “adjustment rule to Noda Time representation” with adjustment rules as they would show up on Linux.

There’s one slightly fiddly bit: I suspect that detecting “base UTC offset delta” for .NET Core 3.1 will require the time zone itself (as we can’t get to the rule data). I might get all the rest of the unit tests working first (and even the non-zero-delta ones for .NET 6) and come back to that.

That’s all for now…

I’ve now implemented the above test data in uncommitted code. After starting to include strings directly into the code, I’ve decided to put all the test data in a text file, pretty much as it’s specified above (just with very minor formatting changes). This is going to be really handy in terms of having readable test cases; I’m already glad I’ve put the effort into it.

However, I’ve discovered that it’s incomplete, as we need test cases for offset changes across the international date line (in both directions). It’s also possible that the choice of America/Sao_Paulo is unfortunate, as Brazil changed clocks at midnight. We might want an example in Australia as well. (Potentially even two: one with whole hour offsets and one with half hour offsets.)

Even without that additional test, there are issues. I can get all but “Europe/Dublin in 1968” to work in .NET 6. I haven’t yet worked out how to handle changing standard offsets in .NET Core 3.1 in a testable way. Even the fact that standard offsets can change is a pain, in terms of working out the transition times in .NET 6, as it appears to be something like “Assume the start is in standard time and the end is in daylight time, except don’t take any standard time deltas into account when calculating that” – which is very weird indeed. (And I don’t understand how the Europe/Dublin data in .NET 6 is meant to convey the expected data. It’s very odd.)

This post is quite long enough though, so I’m going to post it now and take a break from time zones for a bit. Hopefully I’ll post a “part 2” when I’ve actually got everything working.

Just as a reminder, supposedly these changes in .NET 6: “don’t affect external behavior, other than to ensure correctness in some edge cases”. Mmm. Really.

Playing with an X-Touch Mini controller using C#

Background

As I wrote in my earlier blog post about using OSC to control a Behringer XR16, I’m working on code to make our A/V system at church much easier to work with. From an audio side, I’ve effectively accomplished two goals already:

  • Remove the intimidating hardware mixer with about 150 physical knobs/buttons
  • Allow software to control both audio and visual aspects at the same time (for example, switching from “displaying the preacher with their microphone on” to “displaying hymn words with all microphones muted”)

I have a third goal, however, to accommodate those who are willing to work the A/V system but would really prefer to hardly touch a computer. The requires bringing hardware back into the system. Having removed a mixer, I want to introduce something a bit like a mixer again, but keeping it much simpler (and still with the ability for software to do most of the heavy lifting). While I haven’t blogged about it (yet), I’m expecting most of the “work” during a service to be performed via a Stream Deck XL. The technical aspects of that aren’t terribly interesting, thanks to the highly competent StreamDeckSharp library. But there are plenty of interesting UI design decisions – some of which may be simple to those who know about UI design, but which I find challenging due to a lack of existing UI skills.

The Stream Deck only provides press buttons though – there’s no form of analog control, which is typically what you want to adjust an audio level. Also, I’m not expecting the Stream Deck to be used in every situation. If someone is hosting a meeting with a speaker who needs a microphone, but the meeting isn’t being shared on Zoom, and there are no slides (or just one slide deck for the whole meeting), then there’s little benefit in going for the full experience. You just want a simple way of controlling the audio system.

For those who are happy using a computer, I’m providing a very simple audio mixer app written in WPF for this – a slider and a checkbox per channel, basically. I’ve been looking for the best way to provide a similar experience for those would prefer to use something physical, but without adding significant complexity or financial cost.

Physical control surfaces

I’ve been looking at all kinds of control surfaces for this purpose, and my previous expectation was that I’d use a Loupedeck Live. I’m currently somewhat blocked by the lack of an SDK for it (which will hopefully go public in the summer) but I’m now not sure I’ll use it in the church building anyway. (I’m sure I’ll find fun uses for it at home though. I don’t regret purchasing one.) My other investigations for control surfaces found the Monogram modular system which looks amazing, but which is extremely expensive. In an ideal world, I would like a control surface which has the following properties, in roughly descending order of priority:

  1. Easy to interact with from software (e.g. an SDK, network protocol, MIDI or similar – with plenty of documentation)
  2. Provides analog, fine-grained control so that levels can be adjusted easily
  3. Provides visual output for the state of the system
  4. Modular (so I can have just the controls we need, to keep it simple and unintimidating) or at least available with “roughly the set of controls we need and not much more”
  5. Has small displays (like the Stream Deck) so channel labels (etc) could be updated dynamically in software

Point 3 is an interesting one, and is where most options fall down. The two physical form factors that are common for adjust levels are rotary knobs, and faders (aka sliders). Faders are frankly a little easier to use than knobs, but both are acceptable. The simple version for both of these assumes that it has complete control over the value being adjusted. A fader’s value is simply the vertical position. Simple knobs often have line or other indications of the current value, and hard stops at the end of the range (i.e. if you turn them to the maximum or minimum value, you can’t physically turn them any further). Likewise, simple buttons used for muting are usually pressed or not, on a toggle basis.

All of these simple controls are inappropriate for the system I want to build, because changes from other parts of the system (e.g. my audio mixer app, or the full service presentation app, or the X-Air application that comes with XR mixers) couldn’t be shown on the physical control surface: anyone looking at the control surface would get the wrong impression of the current state.

However, there are more flexible versions of each control:

  • There are knobs which physically allow you to keep turning them forever, but which have software-controlled rings of lights around them to show the current logical position.
  • There are motorized faders, whose position can be adjusted by software
  • There are buttons that always come back up (like keys on a keyboard) but which have lights to indicate whether they’re logically “on” or “off”.

If I had unlimited budget, I’d probably go with motorized faders (although it’s possible that they’d be a bit disconcerting at first, moving around on their own). They tend to be only available on expensive control surfaces though – often on systems which do far more than I actually want them to, with rather more controls than I want. The X-Touch Compact is probably the closest I’ve found, but it’s overkill in terms of the number of controls, and costs more than I want to spent on this part of the system.

Just to be clear: I have nothing against control surfaces which don’t meet my criteria. What I’m building is absolutely not the typical use case. I’m sure all the products I’ve looked at are highly suitable for their target audiences. I suspect that most people using audio mixers either as a hobby or professionally are tech savvy and don’t mind ignoring controls they don’t happen to need right now. If you’re already using a DAW (Digital Audio Workstation), the hardware complexity we’re talking about is no big deal. But the target audience for my system is very, very different.

Enter the X-Touch Mini

Last week, I found the X-Touch Mini – also by Behringer, but I want to stress that this is pretty much coincidental. (I could use the X-Touch Mini to control non-Behringer mixers, or a non-Behringer controller for the XR16/XR18.) It’s not quite perfect for our needs, but it’s very close.

It consists of the following controls:

  • 8 knobs without hard stops, and with light ring displays. These can also be pressed/released.
  • A top row of 8 unlabeled buttons
  • A bottom row of labeled buttons (MC, rewind, fast forward, loop, stop, play and record)
  • One unmotorized fader
  • Two “layer” buttons

My intention is to use these as follows:

  • Knobs will control the level of each individual channel, with the level being indicated by the light ring
  • Unlabeled buttons will control muting, with the buttons for active (unmuted) channels lit
  • The fader will control the main output volume (which should usually be at 0 dB)

That leaves the following aspects unused:

  • The bottom row of buttons
  • Pressing/releasing knobs
  • The layer buttons

The fact that the fader isn’t motorized is a minor inconvenience, but the fact that it won’t represent the state of the system (unless the fader was the last thing to change it) is relatively insignificant compared with the state of the channels. We tend to tweak individual channels much more than the main volume… and if anyone does set the main volume from the X-Touch Mini, it’s likely that they’ll do so consistently for the whole event, so any “jump” in volume would only happen once.

So, that’s the physical nature of the device… how do we control it?

Standard mode and Mackie Control mode

One of the recurring themes I’ve found with audio equipment is that there are some really useful protocols that are woefully under-documented. That’s often because different physical devices will interpret the protocol in slightly different ways to account for their control layout etc. I completely understand why it’s tricky (and that writing documentation isn’t particularly fun – I’m as guilty as anyone else of putting it off) but it’s still frustrating. This also goes back to me not being a typical user, of course. I suspect that the vast majority of users can plug the X-Touch Mini into their computers, fire up their DAW and get straight to work with it, potentially configuring it within the DAW itself.

Still, between the user manual (which is generally okay) and useful pages scattered around the web (particularly this Stack Overflow answer) I’ve worked things out a lot more. The interface is entirely through MIDI messages (over USB). Fortunately, I already have a fair amount of experience in working with MIDI from C#, via my V-Drum Explorer project. The controller acts as both a MIDI output (for button presses etc) and a MIDI input (to receive light control messages and the like).

The X-Touch Mini has two different modes: “standard” mode, and Mackie Control mode. That’s what the MC on the bottom row of buttons means; that button is used to switch modes while it’s starting up, but can be used for other things once it’s running. The Mackie Control protocol (also known as Mackie Control Universal or MCU) is one of the somewhat-undocumented protocols in the audio world. (It may well be documented exhaustively across the web, but it’s not like there’s one obviously-authoritative source with all the details you might like which comes up with a simple search.)

In standard mode, the X-Touch Mini expects to be primarily in charge of the “display” aspect of things. While you can change the button and knob lights through software, next time you do anything with that control it will reset itself. That’s probably great for simple integrations, but makes it harder to use as a “blank canvas” in the way that I want to. Standard mode is also where the layer buttons have meaning: there are two layers (layer A and layer B), effectively doubling the number of knobs/buttons, so you could handle 16 channels, channels 1-8 on layer A and channels 9-16 on layer B.

In Mackie Control mode, the software controls everything. The hardware doesn’t even keep a notional track of the position of a knob – the messages are things like “knob 1 moved clockwise with speed 5” etc. Very slightly annoyingly, although there are 13 lights in the light ring around each knob, only 11 are accessible within Mackie Control Mode – due to limitations of the protocol, as I understand it. But other than that, it’s pretty much exactly what I want: direct control of everything, without the X-Touch Mini getting in the way by thinking it knows what I want it to do.

I’ve created a library which allows you to use the X-Touch Mini in both modes, in a reasonably straight-forward way. It doesn’t try to abstract away the differences between the two modes, beyond the fact that both allow you to observe button presses, knob presses, and knob turns as events. There’s potentially a little more I could do to push commonality up the stack a bit, but I suspect it would rarely be useful – I’d expect most apps to work in one mode or the other, but not both.

Interfacing with the XR16/XR18

This part was the easy bit. The audio mixer WPF app has a model of “a channel” which allows you to send an update request, and provides information about the channel name, fader position, mute state, and even current audio level. All I had to do was translate MIDI output from the X-Touch Mini into changes to the channel model, and translate property changes on the channel model into changes to the light rings and button lights. The code for this, admittedly without any tests and very few comments, is under 200 lines in total (including using directives etc).

It’s not always easy to imagine what this looks like in reality, so I’ve recorded a short demo video on YouTube. It shows the X-Touch Mini, along with X-Air and the WPF audio mixer app, all synchronized and working together beautifully. (I don’t actually demonstrate the main volume fader on the video, but I promise it works… admittedly the values on the physical fader don’t all align perfectly with the values on the mixer, but they’re not far off… and the important 0 dB level does line up.)

One thing I show in the demo is how channels 3 and 4 form a stereo pair in the mixer. The X-Touch Mini code doesn’t have any configuration telling it that at all, and yet the lights all work as you’d want them to. This is a pleasant quirk of the way that the lighting code is hooked up purely to the information provided by the mixer. When you press a button to unmute a channel, for example, that code sends a request to the mixer, but does not light the button. The light only comes on because the mixer then notifies everything that the channel has been unmuted. When you do anything with channels 3 or 4, the mixer notifies all listening applications about changes to both 3 and 4, and the X-Touch Mini just reacts accordingly to update the light ring or button. It makes things a lot simpler than having to try to keep an independent model of what the X-Touch Mini “thinks” the mixer state is.

I was slightly concerned to start with that this aspect of the design would make it unresponsive when turning a knob: several MIDI events are generated, and if the latency between “send request to mixer” and “mixer notifies apps of change” was longer than the gap between the MIDI events, that would cause problems. Fortunately, that doesn’t seem to be the case – the mixer responds very quickly, before the follow-up MIDI requests from the X-Touch for continued knob turning are sent.

Show me the code!

All the code for this is in my GitHub DemoCode repo, in the XTouchMini directory.

Unless you happen to have an X-Touch Mini, it probably won’t be much use to you… but you may want to have a look at it anyway. I don’t in any way promise that it’s rock-solid, or particularly elegant… but it’s a reasonable start, I think.

That’s all for now… but I’m having so much fun with hardware integration projects that I wouldn’t be surprised to find I’m writing more posts like this over the summer.

Update (2024-01-18): DigiMixer app released containing this code

Nearly 3 years after this post, I have a prepacked app you can use if you want to play with controlling any of the DigiMixer-supported mixers from the X-Touch Mini. See the DigiMixer app post for more details.

OSC mixer control in C#

In some senses, this is a follow on from my post on VISCA camera control in C#. It’s about another piece of hardware I’ve bought for my local church, and which I want to control via software. This time, it’s an audio mixer.

Audio mixers: from hardware controls to software controls

The audio mixer we’ve got in the church building at the moment is a Mackie CFX 12. We’ve had it for a while, and it does the job really well. I have no complaints about its capabilities – but it’s really intimidating for non-techie folks, with about 150 buttons/knobs/faders, most of which never need to be touched (and indeed shouldn’t be touched).

I would like to get to a situation where the church stewards can use something incredibly simple that reflects the semantic change they want (“we’re singing a hymn”, “someone is reading a Bible passage”, “the preacher is starting the sermon” etc) and takes care of adjusting what’s being projected onto the screen, what’s happening with the sound, what the camera is pointing at, and what’s being transmitted via Zoom.

I can’t do that with the Mackie CFX 12 – I can’t control it via software.

Enter the Behringer XR16 – a digital audio mixer. (There are plenty of other options available. This had good reviews, and at least signs of documentation.) Physically, this is just a bunch of inputs and outputs. The only controls on it are a headphone volume knob, and the power switch. Everything else is done via software. The X-Air application can control everything from a desktop, iOS or Android device, which is a good start… but that’s still much too complicated. (Indeed, I find it rather intimidating myself.)

Open Sound Control

Fortunately, the XR16 (along with its siblings, the XR12 and XR18, and the product it was derived from, the X32) implement the Open Sound Control protocol, or OSC. They implement this over UDP, and once you’ve found some documentation, it’s reasonably straightforward. Hat tip at this point to Patrick-Gilles Maillot for not only producing a mass of documentation and code for the X32, but also responding to an email asking whether he had any documentation for the X-Air series (XR-12/16/18)… the document he sent me was invaluable. (Behringer themselves responded to a tech support ticket with a brief but useful document too, which was encouraging.)

OSC consists of packets, each of which has an address such as “/ch/01/mix/on” (the address for muting or unmuting the first input channel) and potentially parameters. For example, to find out whether channel 1 is currently muted, you send a packet consisting of just the address mentioned before. The mixer will respond with a packet with the same address, and a parameter value of 0 if the channel is muted, or 1 if it’s not. If you want to change the value, you send a packet with the parameter. (This is a little like the Roland MIDI protocol for V-Drums – the same command is used to report state as to change state.)

You can also send a packet with an address of “/xremote” to request that for the next 10 seconds, the mixer sends any data changes (e.g. made by other applications, or even the one sending it). Subscribing to volume meters is slightly trickier – there are indexer meter addresses (“/meters/0”, “/meters/1” etc) which mean different things on different devices, and each response has a blob of data with multiple values in. (This is for efficiency: there are many, many meters to monitor, and you wouldn’t want each of them sending a separate packet at 50ms intervals.)

OSC in .NET

The OscCore .NET package provided everything I needed in terms of parsing and formatting OSC packets, so it didn’t take too long to write a prototype experimentation app in WPF.

The screenshot below shows effectively two halves of the UI: one for sending OSC packets manually and logging and packets received, and the other for putting together a crude user interface for more reasonable control. This shows just five inputs on the top, then six aux (mono) outputs and the main stereo output on the bottom.

This is the sort of thing a church steward would need, although the “per aux output” volume control is probably unnecessary – along with the VU meters. I still need to work out exactly what the final application will need (bearing in mind that I’m hoping tweaks will be rare – most of the time the “main” control aspect of the app will do everything), but it’s easier to come up with designs when there’s a working prototype.

OSC mixer app

One interesting aspect of this architecturally is that when a slider is changed in the app, the code currently just sends the command to change the value to the mixer. It doesn’t update the in-memory value… it waits for the mixer to send back a “this value has changed” packet, and that updates the in-memory value (which then updates the position of the slider on the screen). That obviously introduces a bit of lag – but the network and mixer latency is small enough that it isn’t actually noticeable. I’m still not entirely sure it’s the right decision, but it does give me more confidence that the change in value has actually made it to the mixer.

Conclusion

There’s definitely more work to do in terms of design – I’d quite like to move all the Mixer and Channel model code into the “core” library, and I’ll probably do that before creating any “production” applications… but for now, it’s at least good enough to put on GitHub. So it’s available in my democode repo. It’s probably no use at all if you don’t have an XR12/XR16/XR18 (although you could probably tweak it pretty easily for an X18).

But arguably the point of this post isn’t to reach the one or two people who might find the code useful – it’s to try to get across the joy of playing with a hobby project. So if you’ve got a fun project that you haven’t made time for recently, why not dust it off and see what you want to do with it next?

VISCA camera control in C#

During lockdown, I’ve been doing quite a lot of tech work for my local church… mostly acting in a sort of “producer” role for our Zoom services, but also working out how we can enable “hybrid” services when some of us are back in our church buildings, with others still at home. (This is partly a long term plan. I never want to go back to letting down the housebound.)

This has involved sourcing a decent pan/tilt/zoom (PTZ) camera… and then having some fun with it. We’ve ended up using a PTZOptics NDI camera with 30x optical zoom. Now it’s one thing to have a PTZ camera, but then you need to work out what to do with it. There are lots of options on the “how do you broadcast” side of things, which I won’t go into here, but I was interested in the PTZ control part.

Before buying the camera, I knew that PTZOptics cameras exposed an HTTP port which provides a reasonable set of controls, so I was reasonably confident I’d be able to do something. I was also aware of the VISCA protocol and that PTZOptics cameras exposed that over the network as well as the more traditional RS-232 port… but I didn’t have much idea about what the network version of the protocol was.

The manual for the camera is quite detailed, including a complete list of VISCA commands in terms of “these are the bytes you send, and these are the bytes you receive” but without any sort of “envelope” description. It turns out, that’s because there is no envelope when working with VISCA over the network, apparently… you just send the bytes for the command packet (with TCP no-delay enabled of course), and read data until you see an FF that indicates the end of a response packet.

It took me longer to understand this “lack of an envelope” than to actually write the code to use it… once I’d worked out how to send a single command, I was able to write a reasonably complete camera control library quite easily. The code lacks documentation, tests, and decent encapsulation. (I have some ideas about the third of those, which will enable the second, but I need to find time to do the job properly.)

Today I’ve made that code available on GitHub. I’m hoping to refactor it towards decent encapsulation, potentially writing blog posts about that as I go, but until then it might prove useful to others even in its current form. Aside from anything else, it’s proof that I write scrappy code when I’m not focusing on dotting the Is and crossing the Ts, which might help to relieve imposter syndrome in others (while exacerbating it in myself.) I haven’t yet published a package on NuGet, and may never do so, but we’ll see. (It’s easy enough to clone and build yourself though.)

The library comes with a WPF demo app – which is even more scrappily written, without any view models etc. The demo app uses the WebEye WPF RTSP library to show “what the camera sees”. This is really easy to integrate, with one downside that it uses the default FFmpeg buffer size, so there’s a ~2s delay when you move the camera around. That means you wouldn’t want to use this for any kind of production purposes, but that’s not what it’s for :)

Here’s a screenshot of the demo app, focusing on the wind sculpture that Holly bought me as a present a few years ago, and which is the subject of many questions in meetings. (The vertical bar on the left of the sculpture is the door frame of my shed.) As you can see, the controls (top right) are pretty basic. It would be entirely possible to use the library for a more analog approach to panning and tilting, e.g. a rectangle where holding down the mouse button near the corners would move the camera quickly, whereas clicking nearer the middle would move it more slowly.

VISCA demo app

One of the natural questions when implementing a protocol is how portable it is. Does this work with other VISCA cameras? Well, I know it works with the SMTAV camera that I bought for home, but I don’t know beyond that. If you have a VISCA-compatible camera and could test it (either via the demo app or your own code) I’d be really interested to hear how you get on with it. I believe the VISCA protocol is fairly well standardized, but I wouldn’t be surprised if there were some corner cases such as maximum pan/tilt/zoom values that need to be queried rather than hard-coded.

A Tour of the .NET Functions Framework

Note: all the code in this blog post is available in my DemoCode GitHub repo, under Functions.

For most of 2020, one of the projects I’ve been working on is the .NET Functions Framework. This is the .NET implementation of the Functions Framework Contract… but more importantly to most readers, it’s “the way to run .NET code on Google Cloud Functions” (aka GCF). The precise boundary between the Functions Framework and GCF is an interesting topic, but I won’t be going into it in this blog post, because I’m basically more excited to show you the code.

The GitHub repository for the .NET Functions Framework already has a documentation area as well as a quickstart in the README, and there will be .NET instructions within the Google Cloud Functions documentation of course… but this post is more of a tour from my personal perspective. It’s “the stuff I’m excited to show you” more than anything else. (It also highlights a few of the design challenges, which you wouldn’t really expect documentation to do.) It’s likely to form the basis of any conference or user group talks I give on the Functions Framework, too. Oh, and in case you hadn’t already realized – this is a pretty long post, so be warned!

Introduction to Functions as a Service (Faas)

This section is deliberately short, because I expect many readers will already be using FaaS either with .NET on a competing cloud platform, or potentially with GCF and a different language. There are countless articles about FaaS which do a better job than I would. I’ll just make two points though.

Firstly, the lightbulb moment for me around functions as a production value proposition came in a conference talk (I can’t remember whose, I’m afraid) where the speaker emphasized that FaaS isn’t about what you can do with functions. There’s nothing (or maybe I should say “very little” to hedge my bets a bit) you can do with FaaS that you couldn’t do by standing up a service in a Kubernetes cluster or similar. Instead, the primary motivating factor is cost. The further you are away from the business side of things, the less that’s likely to impact on your thinking, but I do think it makes a huge difference. I’ve noticed this personally, which has helped my understanding: I have my own Kubernetes cluster in Google Kubernetes Engine (GKE) which runs jonskeet.uk, csharpindepth.com, nodatime.org and a few other sites. The cluster has three nodes, and I pay a fairly modest amount for it each month… but it’s running out of resources. I could reduce the redundancy a bit and perform some other tweaks, but fundamentally, adding a new test web site for a particular experiment has become tricky. Deploying a function, however, is likely to be free (due to the free tier) and will at worst be incremental.

Secondly, there’s a practical aspect I hadn’t considered, which is that deploying a function with the .NET Functions Framework is now my go-to way of standing up a simple server, even if it has nothing to do with typical functions use cases. Examples include:

  • Running some (fairly short-running) query benchmarks for Datastore to investigate a customer issue
  • Starting a server locally as a simple way of doing the OAuth2 dance when I was working out how to post to WordPress
  • Creating a very simple “current affairs aggregator” to scrape a few sites that I found myself going to repeatedly

Okay, I’m massively biased having written the framework, and therefore knowing it well – but even so, I’m surprised by the range of situations where having a simple way to deploy simple code is really powerful.

Anyway, enough with the background… let’s see how simple it really is to get started.

Getting started: part 1, installing the templates

Firstly, you need the .NET Core SDK version 3.1 or higher. I suspect that won’t rule out many of the readers of this blog :)

The simplest way of getting started is to use the templates NuGet package, so you can then create Functions projects using dotnet new. From a command line, install the templates package like this:

dotnet new -i Google.Cloud.Functions.Templates::1.0.0-beta02

(The ::1.0.0-beta02 part is just because it’s still in prerelease. When we’ve hit 1.0.0, you won’t need to specify the version.)

That installs three templates:

  • gcf-http (an HTTP-triggered function)
  • gcf-event (a strongly-typed CloudEvent-triggered function, using PubSub events in the template)
  • gcf-untyped-event (an “untyped” CloudEvent-triggered function, where you’d have to deserialize the CloudEvent data payload yourself)

All the templates are available for C#, VB and F#, but I’ll only focus on C# in this blog post.

In the current (October 2020) preview of Visual Studio 2019 (which I suspect will go GA in November with .NET 5) there’s an option to use .NET Core templates in the “File -> New Project” experience, and the templates work with that. You need to enable it in “Options -> Environment -> Preview Features -> Show all .NET Core templates in the New project dialog”. The text for the Functions templates needs a bit of an overhaul, but it’s nice to be able to do everything from Visual Studio after installing the templates. I’ll show the command lines for now though.

Getting started: part 2, hello world

I see no point in trying to be innovative here: let’s start with a function that just prints Hello World or similar. As luck would have it, that’s what the gcf-http template provides us, so we won’t actually need to write any code at all.

Again, from a command line, run these commands:

mkdir HelloWorld
cd HelloWorld
dotnet new gcf-http

You should see a confirmation message:

The template “Google Cloud Functions HttpFunction” was created successfully.

This will have created two files. First, HelloWorld.csproj:

<Project Sdk="Microsoft.NET.Sdk">
  <PropertyGroup>
    <OutputType>Exe</OutputType>
    <TargetFramework>netcoreapp3.1</TargetFramework>
  </PropertyGroup>

  <ItemGroup>
    <PackageReference Include="Google.Cloud.Functions.Hosting" Version="1.0.0-beta02" />
  </ItemGroup>
</Project>

And Function.cs:

using Google.Cloud.Functions.Framework;
using Microsoft.AspNetCore.Http;
using System.Threading.Tasks;

namespace HelloWorld
{
    public class Function : IHttpFunction
    {
        /// <summary>
        /// Logic for your function goes here.
        /// </summary>
        /// <param name="context">The HTTP context, containing the request and the response.</param>
        /// <returns>A task representing the asynchronous operation.</returns>
        public async Task HandleAsync(HttpContext context)
        {
            await context.Response.WriteAsync("Hello, Functions Framework.");
        }
    }
}

Right – you’re now ready to run the function. Once more, from the command line:

dotnet run

… the server should start, with log messages that are very familiar to anyone with ASP.NET Core experience along with an introductory log message that’s specific to the Functions Framework.

[Google.Cloud.Functions.Hosting.EntryPoint] [info] Serving function HelloWorld.Function

Point a browser at http://localhost:8080 and you should see the message of “Hello, Functions Framework.” Great!

You may be wondering exactly what’s going on at this point, and I promise I’ll come back to that. But first, let’s deploy this as a Google Cloud Function.

Getting started: part 3, Google Cloud Functions (GCF)

There are a few prerequisites. You need:

  • A Google Cloud Platform (GCP) project, with billing enabled (although as I mentioned earlier, experimentation with Functions is likely to all come within the free tier)
  • The Cloud Functions and Cloud Build APIs enabled
  • The Google Cloud SDK (gcloud)

Rather than give the instructions here, I suggest you go to the Java GCF quickstart docs and follow the first five steps of the “Creating a GCP project using Cloud SDK” section. Ignore the final step around preparing your development environment. I’ll update this post when the .NET quickstart is available.

Once all the prerequisites are available, the actual deployment is simple. From the command line:

gcloud functions deploy hello-world --runtime=dotnet3 --entry-point=HelloWorld.Function --trigger-http --allow-unauthenticated

That’s all on one line so that it’s simple to cut and paste even into the Windows command line, but it breaks down like this:

  • gcloud functions deploy – the command we’re running (deploy a function)
  • hello-world – the name of the function we’re creating, which will appear in the Functions console
  • --runtime=dotnet3 – we want to use the .NET runtime within GCF
  • --entry-point=HelloWorld.Function – this specifies the fully qualified name of the target function type.
  • --trigger-http – the function is triggered via HTTP requests (rather than events)
  • --allow-unauthenticated – the function can be triggered without authentication

Note: if you used a directory other than HelloWorld earlier, or changed the namespace in the code, you should adjust the --entry-point command-line argument accordingly. You need to specify the namespace-qualified name of your function type.

That command uploads your source code securely, builds it, then deploys it. (When I said that having the .NET Core SDK is a prerequisite, that’s true for the template and running locally… but you don’t need the SDK installed to deploy to GCF.)

The function will take a couple of minutes to deploy – possibly longer for the very first time, if some resources need to be created in the background – and eventually you’ll see all the details of the function written to the console. This is a bit of a wall of text, but you want to look for the httpsTrigger section and its url value. Visit that URL, and hey presto, you’re running a function.

If you’re following along but didn’t have any of the prerequisites installed, that may have taken quite a while – but if you’re already a GCP user, it’s really pretty quick.

Personal note: I’d love it if we didn’t need to specify the entry point on the command line, for projects with only one function. I’ve made that work when just running dotnet run, as we saw earlier, but currently you do have to specify the entry point. I have some possibly silly ideas for making this simpler – I’ll need to ask the team how feasible they are.

What’s in a name?

We’ve specified two names in the command line:

  • The name of the function as it will be shown within the Functions Console. (This is hello-world in our example.)
  • The name of the class implementing the function, specified using --entry-point. (This is HelloWorld.Function in our example.)

When I started working with Google Cloud Functions, I got a bit confused by this, and it seems I’m not the only one.

The two names really are independent. We could have deployed the same code multiple times to create several different functions listening on several different URLs, but all specifying the same entry point. Indeed, I’ve done this quite a lot in order to explore the exact HTTP request used by Pub/Sub, Storage and Firebase event triggers: I’ve got a single project with a function class called HttpRequestDump.Function, and I’ve deployed that multiple times with functions named pubsub-test, storage-test and so on. Each of those functions is then independent – they have separate logs, I can delete one without it affecting the others, etc. You could think of them as separate named “instances” of the function, if you want.

What’s going on? Why don’t I need a Main method?

Okay, time for some explanations… at least of the .NET side of things.

Let’s start with the packages involved. The Functions Framework ships four packages:

  • Google.Cloud.Functions.Framework
  • Google.Cloud.Functions.Hosting
  • Google.Cloud.Functions.Testing
  • Google.Cloud.Functions.Templates

We’ve already seen what the Templates package provides, and we’ll look at Testing later on.

The separation between the Hosting package and the Framework package is perhaps a little arbitrary, and I expect it to be irrelevant to most users. The Framework package contains the interfaces that functions need to implement, and adapters between them. If you wanted to host a function yourself within another web application, for example, you could depend just on the Framework package, and your function could have exactly the same code as it does otherwise.

The Hosting package is what configures and starts the server in the more conventional scenario, and this is the package that the “normal” functions deployment scenario will depend on. (If you look at the project file from earlier, you’ll see that it depends on the Hosting package.)

While the Hosting package has become a bit more complex over the course of the alpha and beta releases, it’s fundamentally very small considering what it does – and that’s all because it builds on the foundation of ASP.NET Core. I cannot stress this enough – without the fantastic work of the ASP.NET Core team, we wouldn’t be in this position now. (Maybe we’d have built something from scratch, I don’t know. I’m not saying there wouldn’t be a product, just that I really appreciate having this foundation to build on.)

None of that explains how we’re able to just use dotnet run without having a Program.cs or anything else with a Main method though. Sure, C# 9 has fancy features around top-level programs, but that’s not being used here. (I do want to see if there’s something we can do there, but that’s a different matter.)

This is where Project Dragonfruit comes in – inspirationally, at least. This is a relatively little-known project as part of the System.CommandLine effort; Scott Hanselman’s blog post on it sets the scene pretty well.

The cool thing about Project Dragonfruit is that you write a Main method that has the parameters you want with the types that you want. You can still use dotnet run, and all the parsing happens magically before it gets to your code. The magic is really in the MSBuild targets that come as part of the NuGet package. They generate a bit of C# code that first calls the parser and then calls your Main method, and set that generated code as the entry point.

My JonSkeet.DemoUtil NuGet package (which I really ought to document some time) does the same thing, allowing me to create a project with as many Main methods as I want, and then get presented with a menu of them when I run it. Perfect for demos in talks. (Again, this is copying the idea from Project Dragonfruit.)

And that’s basically what the Hosting package in the Functions Framework does. The Hosting package exposes an EntryPoint class with a StartAsync method, and there are MSBuild targets that automatically generate the entry point for you (if the consuming project is an executable, and unless you disable it).

You can find the generated entry point code in the relevant obj directory (e.g. obj/Debug/netcoreapp3.1) after building. The code looks exactly like this, regardless of your function:

// <auto-generated>This file was created automatically</auto-generated>
using System.Runtime.CompilerServices;
using System.Threading.Tasks;
[CompilerGenerated]
internal class AutoGeneratedProgram
{
    public static Task<int> Main(string[] args) =>
        Google.Cloud.Functions.Hosting.EntryPoint.StartAsync(
             typeof(global::AutoGeneratedProgram).Assembly, args);
}

Basically it calls EntryPoint.StartAsync and passes in “the assembly containing the function” (and any command line arguments). Everything else is done by EntryPoint.

We’ll see more of the features of the Hosting package later on, but at least this has answered the question of how dotnet run works with our HelloWorld function.

Testing HelloWorld

Okay, so we’ve got HelloWorld to run locally, and we’ve deployed it successfully… but are we convinced it works? Well yes, I’m pretty sure it does, but even so, it would be nice to test that.

I’m a big fan of “testing” packages – additional NuGet packages to make it easier to use code that works with that core package. So for example, with NodaTime there’s a NodaTime.Testing package, which we’ll actually use later in this blog post. I don’t know where I got the name “testing” from – it may have been an internal Google convention that I decided to use from NodaTime – but the concept is really handy.

As I mentioned earlier, there’s a Google.Cloud.Functions.Testing package, and now I’ve explained the naming convention you can probably guess that it’s going to get involved.

The Testing package provides:

  • An in-memory ILogger and ILoggerProvider so you can easily unit test functions that use logging, including testing the logs that are written. (IMO this should really be something available in ASP.NET Core out of the box.)
  • A simple way of creating a test server (using Microsoft.AspNetCore.TestHost), which automatically installs the in-memory logger.
  • A base class for tests that automatically creates a test server for a function, and exposes common operations such as “make a GET request and retrieve the text returned”.

Arguably it’s a bit unconventional to have a base class for tests like this. It’s entirely possible to use composition instead of inheritance. But my experience writing the samples for the Functions Framework led me to dislike the boilerplate code that came with composition. I don’t mind the bit of a code smell of using a base class, when it leads to simple tests.

I won’t go through all of the features in detail, but let’s look at the test for HelloWorld. There’s really not much to test, given that there’s no conditional logic – we just want to assert that when we make a request to the server, it writes out “Hello, Functions Framework.” in the response.

Just for variety, I’ve decided to use NUnit in the sample code for this blog post. Most of my tests for work code use xUnit these days, but nothing in the Testing package depends on actual testing packages, so it should work with any test framework you want.

Test lifecycle note: different test frameworks use different lifecycle models. In xUnit, a new test class instance is created for each test case, so we get a “clean” server each time. In NUnit, a single test fixture instance is created and used for all tests, which means there’s a single server, too. The server is expected to be mostly stateless, but if you’re testing against log entries in NUnit, you probably want a setup method. There’s an example later.

So we can set up the project simply:

mkdir HelloWorld.Tests
cd HelloWorld.Tests
dotnet new nunit -f netcoreapp3.1
dotnet add package Google.Cloud.Functions.Testing --version 1.0.0-beta02
dotnet add reference ../HelloWorld/HelloWorld.csproj

(I’d normally do all of this within Visual Studio, but the command line shows you everything you need in terms of project setup. Note that I’ve specified netcoreapp3.1 as the target framework simply because I’ve got the preview of .NET 5 installed, which leads to a default target of net5… and that’s incompatible with the function project.)

With the project in place, we can add the test itself:

using Google.Cloud.Functions.Testing;
using NUnit.Framework;
using System.Threading.Tasks;

namespace HelloWorld.Tests
{
    public class FunctionTest : FunctionTestBase<Function>
    {
        [Test]
        public async Task RequestWritesMessage()
        {
            string text = await ExecuteHttpGetRequestAsync();
            Assert.AreEqual("Hello, Functions Framework.", text);
        }
    }
}

The simplicity of testing is one of the things I’m most pleased with in the Functions Framework. In this particular case I’m happy to use the default URI (“sample-uri”) and a GET request, but there are other methods in FunctionTestBase to make more complex requests, or to execute CloudEvent functions.

So is this a unit test or an integration test? Personally I’m not too bothered by the terminology, but I’d call this an integration test in that it does check the integration through the Functions stack. (It doesn’t test integration with anything else because the function doesn’t integrate with anything else.) But it runs really quickly, and this is my “default” kind of test for functions now.

Beyond hello world: what’s the time?

Let’s move from a trivial function to a cutting-edge, ultra-complex, get-ready-for-mind-melting function… we’re going to report the current time. More than that, we’re going to optionally report the time in a particular time zone. (You knew I’d bring time zones into this somehow, right?)

Rather than walk you through every small step of the process of setting this up, I’ll focus on the interesting bits of the code. If you want to see the complete code, it’s in the ZoneClock and ZoneClock.Tests directories in GitHub.

Regular readers will be unsurprised that I’m going to use NodaTime for this. This short function will end up demonstrating plenty of features:

  • Dependency injection via a “Function Startup class”
  • Logger injection
  • Logger behaviour locally vs in GCF
  • Testing a function that uses dependency injection
  • Testing log output

Let’s start with the code itself. We’ll look at it in three parts.

First, the function class:

[FunctionsStartup(typeof(Startup))]
public class Function : IHttpFunction
{
    private readonly IClock clock;
    private readonly ILogger logger;

    // Receive and remember the dependencies.
    public Function(IClock clock, ILogger<Function> logger) =>
        (this.clock, this.logger) = (clock, logger);

    public async Task HandleAsync(HttpContext context)
    {
        // Implementation code we'll look at later
    }
}

Other than the attribute, this should be very familiar code to ASP.NET Core developers – our two dependencies (a clock and a logger) are provided in the constructor, and remembered as fields. We can then use them in the HandleAsync method.

For any readers not familiar with NodaTime, IClock is an interface with a single method: Instant GetCurrentInstant(). Any time you would call DateTime.UtcNow in DateTime-oriented code, you want to use a clock in NodaTime. That way, your time-sensitive code is testable. There’s a singleton implementation which simply delegates to the system clock, so that’s what we need to configure in terms of the dependency for our function, when running in production as opposed to in tests.

Dependency injection with Functions startup classes

Dependency injection is configured in the .NET Functions Framework using Functions startup classes. These are a little bit like the concept of the same name in Azure Functions, but they’re a little more flexible (in my view, anyway).

Functions startup classes have to derive from Google.Cloud.Functions.Hosting.FunctionsStartup (which is a regular class; the attribute is called FunctionsStartupAttribute, but C# allows you to apply the attribute just using FunctionsStartup and it supplies the suffix).

FunctionsStartup is an abstract class, but it doesn’t contain any abstract members. Instead, it has four virtual methods, each with a no-op implementation:

  • void ConfigureAppConfiguration(WebHostBuilderContext context, IConfigurationBuilder configuration)
  • void ConfigureServices(WebHostBuilderContext context, IServiceCollection services)
  • void ConfigureLogging(WebHostBuilderContext context, ILoggingBuilder logging)
  • void Configure(WebHostBuilderContext context, IApplicationBuilder app)

These will probably be familiar to ASP.NET Core developers – they’re the same configuration methods that exist on IWebHostBuilder.

A Functions startup class overrides one or more of these methods to configure the appropriate aspect of the server. Note that the final method (Configure) is used to add middleware to the request pipeline, but the Functions Framework expects that the function itself will be the last stage of the pipeline.

The most common method to override (in my experience so far, anyway) is ConfigureServices, in order to configure dependency injection. That’s what we need to do in our example, and here’s the class:

public class Startup : FunctionsStartup
{
    public override void ConfigureServices(WebHostBuilderContext context, IServiceCollection services) =>
        services.AddSingleton<IClock>(SystemClock.Instance);
}

This is the type referred to by the attribute on the function class:

[FunctionsStartup(typeof(Startup))]

Unlike “regular” ASP.NET Core startup classes (which are expected to configure everything), Functions startup classes can be composed. Every startup that has been specified either on the function type, or its based types, or the assembly, is used. If you need the startups to be applied in a particular order, you can specify that in the attribute.

Only the function type that is actually being served is queried for attributes. You could have two functions in the same project, and each of them have different startup class attributes… along with assembly attributes specifying any startup classes that both functions want.

Note: when running from the command line, you can specify the function to serve as a command line argument or an environment variable. The framework will fail to start (with a clear error) if you try to run a project with multiple functions, but without specifying which one you want to serve.

The composition aspect allows third parties to integrate with the .NET Functions Framework cleanly. For example, Steeltoe could provide a Steeltoe.GoogleCloudFunctions package containing a bunch of startup classes, and you could just specify (in attributes) which ones you wanted to use for any given function.

Our Startup class only configures the IClock dependency. It doesn’t need to configure ILogger, because ASP.NET Core does this automatically.

Finally, we can write the actual function body. This is reasonably simple. (Yes, it’s nearly 30 lines long, but it’s still straightforward.)

public async Task HandleAsync(HttpContext context)
{
    // Get the current instant in time via the clock.
    Instant now = clock.GetCurrentInstant();

    // Always write out UTC.
    await WriteTimeInZone(DateTimeZone.Utc);

    // Write out the current time in as many zones as the user has specified.
    foreach (var zoneId in context.Request.Query["zone"])
    {
        var zone = DateTimeZoneProviders.Tzdb.GetZoneOrNull(zoneId);
        if (zone is null)
        {
            logger.LogWarning("User provided invalid time zone '{id}'", zoneId);
        }
        else
        {
            await WriteTimeInZone(zone);
        }
    }

    Task WriteTimeInZone(DateTimeZone zone)
    {
        string time = LocalDateTimePattern.GeneralIso.Format(now.InZone(zone).LocalDateTime);
        return context.Response.WriteAsync($"Current time in {zone.Id}: {time}\n");
    }
}

I haven’t bothered to alert the user to the invalid time zone they’ve provided, although the code to do so would be simple. I have logged a warning – mostly so I can demonstrate logging.

The use of DateTimeZoneProviders.Tzdb is a slightly lazy choice here, by the way. I could inject an IDateTimeZoneProvider as well, allowing for tests with custom time zones. That’s probably overkill in this case though.

Logging locally and in production

So, let’s see what happens when we run this.

The warning looks like this:

2020-10-21T09:53:45.334Z [ZoneClock.Function] [warn] User provided invalid time zone 'America/Metropolis'

This is all on one line: the console logger used by default by the .NET Functions Framework when running locally is a little more compact than the default console logger.

But what happens when we run in Google Cloud Functions? Let’s try it…

gcloud functions deploy zone-clock --runtime=dotnet3 --entry-point=ZoneClock.Function --allow-unauthenticated --trigger-http

If you’re following along and deploying it yourself, just visit the link shown in the gcloud output, and add ?zone=Europe/London&amp;zone=America/New_York to show the London and New York time zones, for example.

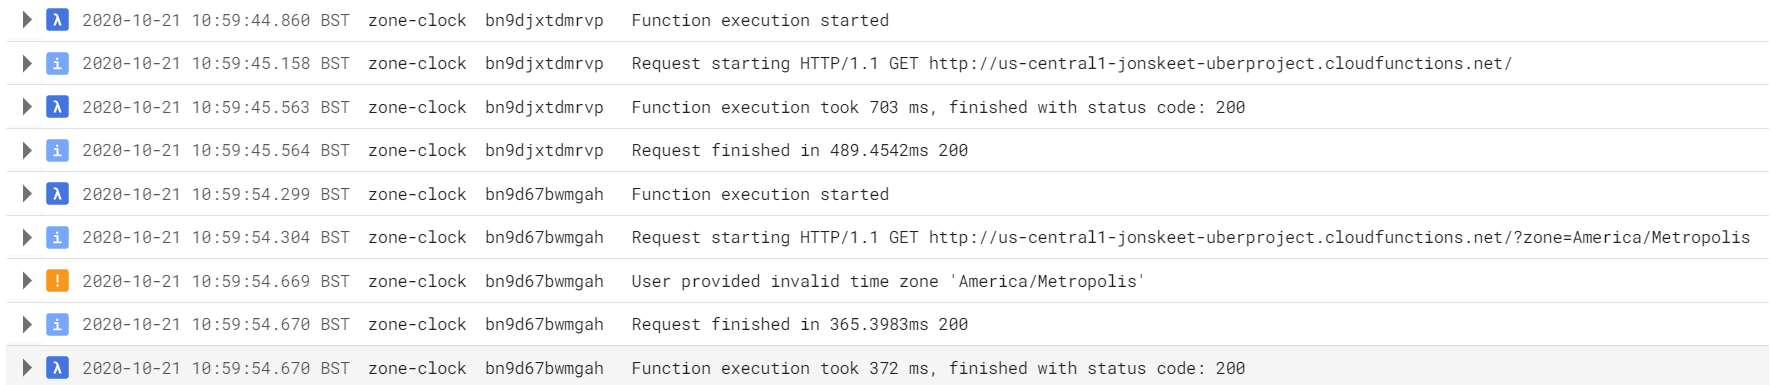
If you go to the Cloud Functions Console and select the zone-clock function, you can view the logs. Here are two requests:

(Click on each image for the full-sized screenshot.)

Warning logs in Functions console

Note how the default “info” logs are differentiated from the “warning” log about the zone ID not being found.

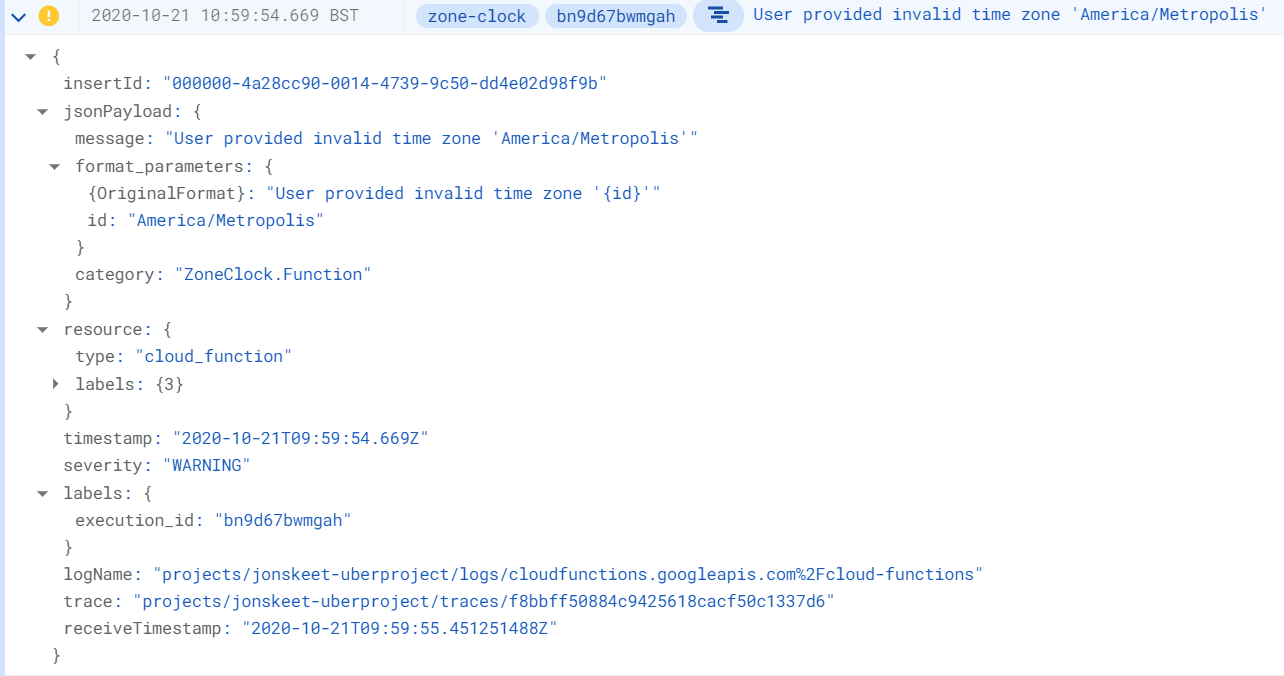
In the Cloud Logging Console you can expand the log entry for more details:

Warning logs in Logging console

You can easily get to the Cloud Logging console from the Cloud Functions log viewer by clicking on the link in top right of the logs. That will take you to a Cloud Logging page with a filter to show just the logs for the function you’re looking at.

The .NET Functions Framework detects when it’s running in a Knative environment, and writes structured JSON to the console instead of plain text. This is then picked up and processed by the logging infrastructure.

Testing with dependencies

So, it looks like our function does what we want it to, but it would be good to have tests to prove it. If we just use a FunctionTestBase like before, without anything else, we’d still get the production dependency being injected though, which would make it hard to write robust tests.

Instead, we want to specify different Functions startup classes for our tests. We want to use a different IClock implementation – a FakeClock from the NodaTime.Testing package. That lets us create an IClock with any time we want. Let’s set it to June 3rd 2015, 20:25:30 UTC:

class FakeClockStartup : FunctionsStartup
{
    public override void ConfigureServices(WebHostBuilderContext context, IServiceCollection services) =>
        services.AddSingleton<IClock>(new FakeClock(Instant.FromUtc(2015, 6, 3, 20, 25, 30)));
}

So how do we tell the test to use that startup? We could manually construct a FunctionTestServer and set the startups that way… but it’s much more convenient to use the same FunctionsStartupAttribute as before, but this time applied to the test class:

[FunctionsStartup(typeof(FakeClockStartup))]
public class FunctionTest : FunctionTestBase<Function>
{
    // Tests here
}

(In my sample code, FakeClockStartup is a nested class inside the test class, whereas the production Startup class is a top-level class. There’s no specific reason for this, although it feels reasonably natural to me. You can organize your startup classes however you like.)

If you have any startup classes which should be used by all the tests in your test project, you can apply FunctionsStartupAttribute to the test assembly.

The tests themselves check two things:

  • The output that’s written to the HTTP response
  • The log entries written by the function (but not by other loggers)

Again, FunctionTestBase makes the latter easy, with a GetFunctionLogEntries() method. (You can get at all the logs if you really want to, of course.)

I’ve actually got three tests, but one will suffice to show the pattern:

[Test]
public async Task InvalidCustomZoneIsIgnoredButLogged()
{
    string actualText = await ExecuteHttpGetRequestAsync("?zone=America/Metropolis&zone=Europe/London");
    // We still print UTC and Europe/London, but America/Metropolis isn't mentioned at all.
    string[] expectedLines =
    {
        "Current time in UTC: 2015-06-03T20:25:30",
        "Current time in Europe/London: 2015-06-03T21:25:30"
    };
    var actualLines = actualText.Split('\n', StringSplitOptions.RemoveEmptyEntries);
    Assert.AreEqual(expectedLines, actualLines);

    var logEntries = GetFunctionLogEntries();
    Assert.AreEqual(1, logEntries.Count);
    var logEntry = logEntries[0];
    Assert.AreEqual(LogLevel.Warning, logEntry.Level);
    StringAssert.Contains("America/Metropolis", logEntry.Message);
}

As a side-note, I generally prefer NUnit over xUnit, but I really wanted to
be able to write:

// Would be valid in xUnit...
var logEntry = Assert.Single(GetFunctionLogEntries());

In xUnit the Assert.Single method validates that its input (GetFunctionLogEntries() in this case) contains a single element, and returns that element so you can perform further assertions on it. There’s no equivalent in NUnit that I’m aware of, although it would be easy to write one.

As noted earlier, we also need to make sure that the logs are cleared before the start of each test, which we can do with a setup method:

[SetUp]
public void ClearLogs() => Server.ClearLogs();

(The Server property in FunctionTestBase is the test server that it
creates.)

Okay, so that’s HTTP functions… what else can we do?

CloudEvent functions

Functions and events go together very naturally. Google Cloud Functions can be triggered by various events, and in the .NET Functions Framework these are represented as CloudEvent functions.

CloudEvents is a CNCF project to standardize the format in which events are propagated and delivered. It isn’t opinionated about the payload data, or how the events are stored etc, but it provides a common “envelope” model, and specific requirements of how events are represented in transports such as HTTP.

This means that you can write at least some code to handle “any event”, and the overall structure should be familiar even if you move between (say) Microsoft-generated and Google-generated events. For example, if both Google Cloud Storage and Azure Blob Storage can emit events (e.g. when an object/blob is created or deleted) then it should be easy enough to consume that event from Azure or Google Cloud Platform respectively. I wouldn’t expect it to be the same code for both kinds of event, but at least the deserialization part of “I have an HTTP request; give me the event information” would be the same. In C#, that’s handled via the C# CloudEvents SDK.

If you’re happy deserializing the data part yourself, that’s all you need, and you can write an untyped CloudEvent function like this:

public class Function : ICloudEventFunction
{
    public Task HandleAsync(CloudEvent cloudEvent, CancellationToken cancellationToken)
    {
        // Function body
    }
}

Note how there’s no request and response: there’s just the event.

That’s all very well, but what if you don’t want to deserialize the data yourself? I don’t want users to have to write their own representation of (say) our Cloud Pub/Sub message event data. I want to make it as easy as possible to consume Pub/Sub messages in functions.

That’s where two other repositories come in:

The latter repository provides two packages at the moment: Google.Events and Google.Events.Protobuf. You can add a dependency in your functions project to Google.Events.Protobuf, and then write a typed CloudEvent function like this:

public class Function : ICloudEventFunction<MessagePublishedData>
{
    public Task HandleAsync(CloudEvent cloudEvent, MessagePublishedData data, CancellationToken cancellationToken)
    {
        // Function body
    }
}

Your function is still provided with the original CloudEvent so it can access metadata, but the data itself is deserialized automatically.

Serialization library choices

There’s an interesting design issue here. The schemas for the event data are originally in protobuf format, and we’re also converting them to JSON schema. It would make sense to be able to deserialize with any of:

  • Google.Protobuf
  • System.Text.Json
  • Newtonsoft.Json

If you’re already using one of those dependencies elsewhere in your code, you probably don’t want to add another of them. So the current plan is to provide three different packages, one for each deserialization library. All of them apply common attributes from the Google.Events package, which has no dependencies itself other than the CloudEvents SDK, and is what the Functions Framework depends on.

Currently we’ve only implemented the protobuf-based option, but I do want to get to the others.

(Note that currently the CloudEvents SDK itself depends on Newtonsoft.Json, but I’m hoping we can remove that dependency before we release version 2.0 of the CloudEvents SDK, which I’m working on jointly with Microsoft.)

That all sounds great, but it means we’ve got three different representations of MessagePublishedData – one for each serialization technology. It would be really nice if we could have just one representation, which all of them deserialized to, based on which serialization package you happened to use. That’s an issue I haven’t solved yet.

I’m hoping that in the world of functions that won’t matter too much, but of course CloudEvents can be produced and consumed in just about any code… and at the very least, it’s a little annoying.

Writing CloudEvent functions

I’m not going to present the same sort of “hello world” experience for CloudEvent functions as for HTTP functions, simply because they’re less “hands on”. Even I don’t get too excited by publishing a Pub/Sub message and seeing a log entry that says “I received a Pub/Sub message with at this timestamp.”

Instead, I’ll draw your attention to an example with full code in the .NET Functions Framework repository.

It’s an example which is in some ways quite typical of how I see CloudEvent functions being used – effectively as plumbing between other APIs. This particular examples listens for Google Cloud Storage events where an object has been created or updated, and integrates it with the Google Cloud Vision API to perform image recognition and annotation. The steps involved are:

  • The object is created or updated in a Storage bucket
  • An event is generated, which triggers the CloudEvent function
  • The function checks the content type and filename, to see whether it’s probably an image. (If it isn’t, it stops at this point.)
  • It asks the Vision API to perform some basic image recognition, looking for faces, text, landmarks and so on.
  • The result is summarised in a “text file object” which is created alongside the original image file.

The user experience is that they can drop an image into Storage bucket, and a few seconds later there’s a second file present with information about the image… all in a relatively small amount of code.

The example should be easy to set up, assuming you have both Storage and Vision APIs enabled – it’s then very easy to test. While you’re looking at that example, I encourage you to look at the other examples in the repository, as they show some other features I haven’t covered.

Of course, all the same testing features for HTTP functions are available for CloudEvent functions too, and there are helper methods in FunctionTestBase to execute the function based on an event and so on. Admittedly API-like dependencies tend to be harder to take out than IClock, but the function-specific mechanisms are still the same.

Conclusion

It’s been so much fun to describe what I’ve been working on, and how I’ve tried to predict typical use cases and make them easy to implement with the .NET Functions Framework.

The framework is now in beta, which means there’s still time to make some changes if we want to… but we won’t know the changes are required unless we get feedback. So I strongly encourage you to give it a try, whether you have experience of FaaS on other platforms or not.

Feedback is best left via issues on the GitHub repository – I’d love to be swamped!

I’m sure there’ll be more to talk about in future blog posts, but this one is already pretty gigantic, so I’ll leave it there for now…

Posting to wordpress.com in code

History

I started blogging back in 2005, shortly before attending the only MVP summit I’ve managed to go to. I hosted the blog on msmvps.com, back when that was a thing.

In 2014 I migrated to wordpress.com, in the hope that this would make everything nice and simple: it’s a managed service, dedicated to blogging, so I shouldn’t have to worry about anything but the writing. It’s not been quite that simple.

I don’t know when I started writing blog posts in Markdown instead of using Windows Live Writer to create the HTML for me, but it’s definitely my preferred way of writing. It’s the format I use all over the place, it makes posting code easy… it’s just “the right format” (for me).

Almost all my problems with wordpress.com have fallen into one of two categories:

  • Markdown on WordPress (via JetPack, I believe) not quite working as I expect it to.
  • The editor on wordpress.com being actively hostile to Markdown users

In the first category, there are two problems. First, there’s my general annoyance at line breaks being relevant outside code. I like writing paragraphs including line breaks, so that the text is nicely in roughly 80-100 character lines. Unfortunately both WordPress and GitHub decide to format such paragraphs as multiple short lines, instead of flowing a single paragraph. I don’t know why the decision was made to format things this way, and I can see some situations in which it’s beneficial (e.g. a diff of “adding a single word” showing as just that diff rather than all the lines in the paragraph changing) but I mostly dislike it.

The second annoyance is that angle brackets in code (either code fences or just in backticks) behave unpredictably in WordPress, in a way that I don’t remember seeing anywhere else. The most common cause of having to update a post is to fix some generics in C# code, mangling to Markdown to escape the angle brackets. One of these days I may try to document this so that I can get it right in future posts, but it’s certainly a frustration.

I don’t expect to be able to do anything about either of these aspects. I could potentially run posts through some sort of preprocessor, but I suspect tha unwrapping paragraphs but not code blocks could get fiddly pretty fast. I can live with it.

The second category of annoyance – editing on wordpress.com – is what this post is mostly about.

I strongly suspect that most bloggers want a reasonably-WYSIWYG experience, and they definitely don’t want to see their post in its raw, unformatted version (usually HTML, but Markdown for me). For as long as I can remember, there have been two modes in the wordpress.com editor: visual and text. In some cases just going into the visual editor would cause the Markdown to be converted into HTML which would then show up in the text editor… it’s been fiddly to keep it as text. My habit is to keep a copy of the post as text (originally just in StackEdit but now in GitHub) and copy the whole thing into WordPress any time I wanted to edit anything. That way I don’t really care what WordPress does with it.

However, wordpress.com have now made even that workflow even harder – they’ve moved to a “blocks” editor in the easy-to-get-to UI, and you can only get to the text editor via the admin UI.

I figured enough was enough. If I’ve got the posts as text locally (then stored on GitHub), there’s no need to go to the wordpress.com UI for anything other than comments. Time to crack open the API.

What no .NET package?

WordPress is a pretty common blogging platform, let’s face it. I was entirely unsurprised to find out that there’s a REST API for it, allowing you to post to it. (The fact that I’d been using StackEdit to post for ages was further evidence of that.) It also wasn’t surprising that it used OAuth2 for authentication, given OAuth’s prevalance.

What was surprising was my inability to find any .NET packages to let me write a C# console application to call the API with really minimal code. I couldn’t even find any simple “do the OAuth dance for me” libraries that would work in a console application rather than in a web app. RestSharp looked promising, as the home page says “Basic, OAuth 1, OAuth 2, JWT, NTLM are supported” – but the authentication docs could do with some love, and looking at the source code suggested there was nothing that would start a local web server just to receive the OAuth code that could then be exchanged for a full auth token. (I know very little about OAuth2, but just enough to be aware of what’s missing when I browse through some library code.) WordPressPCL also looked promising – but requires JWT authentication, which is available via a plugin. I don’t want to upgrade from a personal wordpress.com account to a business account just for the sake of installing a single plugin. (I’m aware it could have other benefits, but…)

So, I have a few options:

  • Upgrade to a business account, install the JWT plugin, and try to use WordPressPCL
  • Move off wordpress.com entirely, run WordPress myself (or find another site like wordpress.com, I suppose) and make the JWT plugin available, and again use WordPressPCL
  • Implement the OAuth2 dance myself

Self-hosting WordPress

I did toy with the idea of running WordPress myself. I have a Google Kubernetes Engine cluster already, that I use to host nodatime.org and some other sites. I figured that by now, installing WordPress on a Kubernetes cluster would be pretty simple. It turns out there’s a Bitnami Helm chart for it, so I decided to give that a go.

First I had to install Helm – I’ve heard of it, but never used it before. My first attempt to use it, via a shell script, failed… but with Chocolatey, it installed okay.

Installing WordPress was a breeze – until it didn’t actually work, because my Kubernetes cluster doesn’t have enough spare resources. It is a small cluster, certainly – it’s not doing anything commercial, and I’m paying for it out of my own pocket, so I try to keep the budget relatively low. Apparently too low.

I investigated how much it might cost to increase the capacity of my cluster so I could run WordPress myself, and when it ended up being more expensive than the business account on wordpress.com (even before the time cost of maintaining the site), I figured I’d stop going down that particular rabbit hole.

Implementing OAuth2

In the end, I really shouldn’t have been so scared of implementing the OAuth2 dance myself. It’s not too bad, particularly when I’m happy to do a few manual steps each time I need a new token, rather than automating everything.

First I had to create an “application” on wordpress.com. That’s really just a registration for a client_secret and client_id, along with approved redirect URIs for the OAuth dance. I knew I’d be running a server locally for the browser to redirect to, so I allowed http://127.0.0.1:8080/auth as a redirect URI, and created the app appropriately.

The basic flow is:

  • Start a local web server to receive a redirect response from the WordPress server
  • Visit a carefully-constructed URL on WordPress in the browser
  • Authorize the request in the browser
  • The WordPress response indicates a redirect to the local server, that includes a code
  • The local server then exchanges that code for a token by making another HTTP request to the WordPress server
  • The local server displays the access token so I can copy and paste it for use elsewhere

In a normal application the user never needs to see the access token of course – all of this happens behind the scenes. However, doing that within my eventual “console application which calls the WordPress API to create or update posts” would be rather more hassle than copy/paste and hard-coding the access token. Is this code secure, if it ever gets stolen? Absolutely not. Am I okay with the level of risk here? Yup.

So, what’s the simplest way of starting an HTTP server in a standalone app? (I don’t need this to integrate with anything else.) You could obviously create a new empty ASP.NET Core application and find the right place to handle the request… but personally I reached for the .NET Functions Framework. I’m clearly biased as the author of the framework, but I was thrilled to see how easy it was to use for a real task. The solution is literally a single C# file and a project file, created with dotnet new gcf-http. The C# file contains a single class (Function) with a single method (HandleAsync). The C# file is 50 lines of code in total.

Mind you, it still took over an hour to get a working token that was able to create a WordPress post. Was this due to intricacies of URL encoding in forms? No, despite my investigations taking me in that direction. Was it due to needing to base64 encode the token when making a request? No, despite many attempts along those lines too.

I made two mistakes:

  • In my exchange-code-for-token server, I populated the redirect_uri field in the exchange request with "http://127.0.0.1/auth" instead of "http://127.0.0.1:8080/auth"
  • In the test-the-token application, I specified a scheme of "Basic" instead of "Bearer" in AuthenticationHeaderValue

So just typos, basically. Incredibly frustrating, but I got there.

As an intriguing thought, now I’ve got a function that can do the OAuth dance, there’s nothing to stop me deploying that as a real Google Cloud Function so I could get an OAuth access token at any time just by visiting a URL without running anything locally. I’d just need a bit of configuration – which ASP.NET Core makes easy, of course. No need to do that just yet.

Posting to WordPress

At this point, I have a test application that can create a WordPress post (as Markdown, importantly). It can update the post as well.

The next step is to work out what I want my blogging flow to be in the future. Given that I’m storing the blog content in GitHub, I could potentially trigger the code from a GitHub action – but I’m not sure that’s a particularly useful flow. For now, I’m going to go with “explicitly running an app when I want to create/update a post”.

Now updating a post requires knowing the post ID – which I can get within the WordPress UI, but I also get when creating the post in the first place. But I’d need somewhere to store it. I could create a separate file with metadata for posts, but this is all starting to sound pretty complex.

Instead, my current solution is to have a little metadata “header” before the main post. The application can read that, and process it appropriately. It can also update it with the post ID when it first creates the post on wordpress.com. That also avoids me having to specify things like a title on the command line. At the time of writing this, this post has a header like this:

title: Posting to wordpress.com in code
categories: C#, General
---

After running my application for the first time, I expect it to be something like this:

postId: 12345
title: Posting to wordpress.com in code
categories: C#, General
---

The presence of the postId field will trigger the app to use “update” instead of “create” next time I ask it to process this file.

Will it work? I’ll find out in just a few minutes. This code hasn’t been run at all yet. Yes, I could write some tests for it. No, I’m not actually going to write the tests. I think it’ll be just as quick to iterate on it by trial and error. (It’s not terribly complicated code.)

Conclusion

If you can see this post, I have a new process for posting to my blog. I will absolutely not create this post manually – if the code never works, you’ll never see this text.

Is this a process that other people would want to use? Maybe, maybe not. I’m not expecting to open source it. But it’s a useful example of how it really doesn’t take that much effort to automate away some annoyance… and I was able to enjoy using my own Functions Framework for realsies, which is a bonus :)

Time to post!

Travis logs and .NET Core console output

This is a blog post rather than a bug report, partly because I really don’t know what’s at fault. Others with more knowledge of how the console works in .NET Core, or exactly what the Travis log does, might be able to dig deeper.

TL;DR: If you’re running jobs using .NET Core 3.1 on Travis and you care about the console output, you might want to set the TERM environment variable to avoid information being swallowed.

Much of my time is spent in the Google Cloud Libraries for .NET repository. That single repository hosts a lot of libraries, and many of the pull requests are from autogenerated code where the impact on the public API surface may not be immediately obvious. (It would be easy to miss one breaking change within dozens of comment changes, for example.) Our Travis build includes a job to work out the public API changes, which is fantastically useful. (Example)

When we updated our .NET Core SDK to 3.1 – or at least around that time; it may have been coincidence – we noticed that some of the log lines in our Travis jobs seemed to be missing. They were actually missing from all the jobs, but it was particularly noticeable for that “change detection” job because the output can often be small, but should always contain a “Diff level” line. It’s really obvious when that line is missing.

I spent rather longer trying to diagnose what was going wrong than I should have done. A colleague noted that clicking on “Raw log” showed that we were getting all the output – it’s just that Travis was swallowing some of it, due to control characters being emitted. This blog post is a distillation of what I learned when trying to work out what was going on.

A simple set of Travis jobs

In my DemoCode repository I’ve created a Travis setup for the sake of this post.

Here are the various files involved:

.travis.yml:

dist: xenial  

language: csharp  
mono: none  
dotnet: 3.1.301  

jobs:  
  include:  
    - name: "Default terminal, no-op program"  
      script: TravisConsole/run-dotnet.sh 0  

    - name: "Default terminal, write two lines"  
      script: TravisConsole/run-dotnet.sh 2  

    - name: "Mystery terminal, no-op program"  
      env: TERM=mystery  
      script: TravisConsole/run-dotnet.sh 0  

    - name: "Mystery terminal, write two lines"  
      env: TERM=mystery  
      script: TravisConsole/run-dotnet.sh 2  

    - name: "Mystery terminal, write two lines, no logo"  
      env: TERM=mystery DOTNET_NOLOGO=true  
      script: TravisConsole/run-dotnet.sh 2

TravisConsole/run-dotnet.sh:

#!/bin/bash  

set -e  

cd $(readlink -f $(dirname ${BASH_SOURCE}))  

echo "Before dotnet run (first)"  
dotnet run -- $1  
echo "After dotnet run (first)"  

echo "Before dotnet run (second)"  
dotnet run -- $1  
echo "After dotnet run (second)"

TravisConsole/Program.cs:

using System;  

class Program  
{  
    static void Main(string[] args)  
    {  
        int count = int.Parse(args[0]);  
        for (int i = 1; i <= count; i++)  
        {  
             Console.WriteLine($"Line {i}");  
        }  
    }  
}

So each job runs the same .NET Core console application twice with the same command line argument – either 0 (in which case nothing is printed out) or 2 (in which case two it prints out “Line 1” then “Line 2”). The shell script also logs before and after executing the console application. The only other differences are in terms of the environment variables:

  • Some jobs use TERM=mystery instead of the default
  • The final job uses DOTNET_NOLOGO=true

I’ll come back to the final job right at the end – we’ll concentrate on the impact of the TERM environment variable first, as that’s the main point of the post. Next we’ll look at the output of the jobs – in each case showing it in the “pretty” log first, then in the “raw” log. The pretty log has colour, and I haven’t tried to reproduce that. I’ve also only shown the relevant bit – the call to run-dotnet.sh.

You can see all of the output shown here in the Travis UI, of course.

Job 1: Default terminal, no-op program

Pretty log

$ TravisConsole/run-dotnet.sh 0
Before dotnet run (first)
Welcome to .NET Core 3.1!
---------------------
SDK Version: 3.1.301
----------------
Explore documentation: https://aka.ms/dotnet-docs
Report issues and find source on GitHub: https://github.com/dotnet/core
Find out what's new: https://aka.ms/dotnet-whats-new
Learn about the installed HTTPS developer cert: https://aka.ms/aspnet-core-https
Use 'dotnet --help' to see available commands or visit: https://aka.ms/dotnet-cli-docs
Write your first app: https://aka.ms/first-net-core-app
--------------------------------------------------------------------------------------
Before dotnet run (second)
The command "TravisConsole/run-dotnet.sh 0" exited with 0.

Note the lack of After dotnet run in each case.

Raw log

[0K$ TravisConsole/run-dotnet.sh 0
Before dotnet run (first)

Welcome to .NET Core 3.1!

---------------------

SDK Version: 3.1.301

----------------

Explore documentation: https://aka.ms/dotnet-docs

Report issues and find source on GitHub: https://github.com/dotnet/core

Find out what's new: https://aka.ms/dotnet-whats-new

Learn about the installed HTTPS developer cert: https://aka.ms/aspnet-core-https

Use 'dotnet --help' to see available commands or visit: https://aka.ms/dotnet-cli-docs

Write your first app: https://aka.ms/first-net-core-app

--------------------------------------------------------------------------------------
[?1h=[?1h=[?1h=[?1h=[?1h=[?1h=[?1h=After dotnet run (first)
Before dotnet run (second)
[?1h=[?1h=[?1h=[?1h=[?1h=[?1h=[?1h=After dotnet run (second)
travis_time:end:18aa556c:start=1595144448336834755,finish=1595144452475616837,duration=4138782082,event=script
[0K[32;1mThe command "TravisConsole/run-dotnet.sh 0" exited with 0.[0m

In the raw log, we can see that After dotnet run is present each time, but with [?1h=[?1h=[?1h=[?1h=[?1h=[?1h=[?1h= before it. Let’s see what happens when our console application actually writes to the console.

Job 2: Default terminal, write two lines

Pretty log

$ TravisConsole/run-dotnet.sh 2
Before dotnet run (first)
Welcome to .NET Core 3.1!
---------------------
SDK Version: 3.1.301
----------------
Explore documentation: https://aka.ms/dotnet-docs
Report issues and find source on GitHub: https://github.com/dotnet/core
Find out what's new: https://aka.ms/dotnet-whats-new
Learn about the installed HTTPS developer cert: https://aka.ms/aspnet-core-https
Use 'dotnet --help' to see available commands or visit: https://aka.ms/dotnet-cli-docs
Write your first app: https://aka.ms/first-net-core-app
--------------------------------------------------------------------------------------
Line 2
Before dotnet run (second)
Line 2
The command "TravisConsole/run-dotnet.sh 2" exited with 0.

This time we don’t have After dotnet run – and we don’t have Line 1 either. As expected, they are present in the raw log, but with control characters before them:

[0K$ TravisConsole/run-dotnet.sh 2
Before dotnet run (first)

Welcome to .NET Core 3.1!

---------------------

SDK Version: 3.1.301

----------------

Explore documentation: https://aka.ms/dotnet-docs

Report issues and find source on GitHub: https://github.com/dotnet/core

Find out what's new: https://aka.ms/dotnet-whats-new

Learn about the installed HTTPS developer cert: https://aka.ms/aspnet-core-https

Use 'dotnet --help' to see available commands or visit: https://aka.ms/dotnet-cli-docs

Write your first app: https://aka.ms/first-net-core-app

--------------------------------------------------------------------------------------
[?1h=[?1h=[?1h=[?1h=[?1h=[?1h=Line 1
Line 2
[?1h=After dotnet run (first)
Before dotnet run (second)
[?1h=[?1h=[?1h=[?1h=[?1h=[?1h=Line 1
Line 2
[?1h=After dotnet run (second)
travis_time:end:00729828:start=1595144445905196926,finish=1595144450121508733,duration=4216311807,event=script
[0K[32;1mThe command "TravisConsole/run-dotnet.sh 2" exited with 0.[0m

Now let’s try with the TERM environment variable set.

Job 3: Mystery terminal, no-op program

$ TravisConsole/run-dotnet.sh 0
Before dotnet run (first)
Welcome to .NET Core 3.1!
---------------------
SDK Version: 3.1.301
----------------
Explore documentation: https://aka.ms/dotnet-docs
Report issues and find source on GitHub: https://github.com/dotnet/core
Find out what's new: https://aka.ms/dotnet-whats-new
Learn about the installed HTTPS developer cert: https://aka.ms/aspnet-core-https
Use 'dotnet --help' to see available commands or visit: https://aka.ms/dotnet-cli-docs
Write your first app: https://aka.ms/first-net-core-app
--------------------------------------------------------------------------------------
After dotnet run (first)
Before dotnet run (second)
After dotnet run (second)
The command "TravisConsole/run-dotnet.sh 0" exited with 0.

That’s more like it! This time the raw log doesn’t contain any characters within the script execution itself. (There are still blank lines in the “logo” part, admittedly. Not sure why, but we’ll get rid of that later anyway.)

[0K$ TravisConsole/run-dotnet.sh 0
Before dotnet run (first)

Welcome to .NET Core 3.1!

---------------------

SDK Version: 3.1.301

----------------

Explore documentation: https://aka.ms/dotnet-docs

Report issues and find source on GitHub: https://github.com/dotnet/core

Find out what's new: https://aka.ms/dotnet-whats-new

Learn about the installed HTTPS developer cert: https://aka.ms/aspnet-core-https

Use 'dotnet --help' to see available commands or visit: https://aka.ms/dotnet-cli-docs

Write your first app: https://aka.ms/first-net-core-app

--------------------------------------------------------------------------------------
After dotnet run (first)
Before dotnet run (second)
After dotnet run (second)
travis_time:end:11222e41:start=1595144449188901003,finish=1595144453242229433,duration=4053328430,event=script
[0K[32;1mThe command "TravisConsole/run-dotnet.sh 0" exited with 0.[0m

Let’s just check that it still works with actual output:

Job 4: Mystery terminal, write two lines

Pretty log

4.45s$ TravisConsole/run-dotnet.sh 2
Before dotnet run (first)
Welcome to .NET Core 3.1!
---------------------
SDK Version: 3.1.301
----------------
Explore documentation: https://aka.ms/dotnet-docs
Report issues and find source on GitHub: https://github.com/dotnet/core
Find out what's new: https://aka.ms/dotnet-whats-new
Learn about the installed HTTPS developer cert: https://aka.ms/aspnet-core-https
Use 'dotnet --help' to see available commands or visit: https://aka.ms/dotnet-cli-docs
Write your first app: https://aka.ms/first-net-core-app
--------------------------------------------------------------------------------------
Line 1
Line 2
After dotnet run (first)
Before dotnet run (second)
Line 1
Line 2
After dotnet run (second)
The command "TravisConsole/run-dotnet.sh 2" exited with 0.

Exactly what we’d expect from inspection. The raw log doesn’t hold any surprises either.

Raw log

[0K$ TravisConsole/run-dotnet.sh 2
Before dotnet run (first)

Welcome to .NET Core 3.1!

---------------------

SDK Version: 3.1.301

----------------

Explore documentation: https://aka.ms/dotnet-docs

Report issues and find source on GitHub: https://github.com/dotnet/core

Find out what's new: https://aka.ms/dotnet-whats-new

Learn about the installed HTTPS developer cert: https://aka.ms/aspnet-core-https

Use 'dotnet --help' to see available commands or visit: https://aka.ms/dotnet-cli-docs

Write your first app: https://aka.ms/first-net-core-app

--------------------------------------------------------------------------------------
Line 1
Line 2
After dotnet run (first)
Before dotnet run (second)
Line 1
Line 2
After dotnet run (second)
travis_time:end:0203f787:start=1595144444502091825,finish=1595144448950945977,duration=4448854152,event=script
[0K[32;1mThe command "TravisConsole/run-dotnet.sh 2" exited with 0.[0m

Job 5: Mystery terminal, write two lines, no logo

While job 4 is almost exactly what we want, it’s still got the annoying “Welcome to .NET Core 3.1!” section. That’s a friendly welcome for users in an interactive context, but pointless for continuous integration. Fortunately it’s now easy to turn off by setting DOTNET_NOLOGO=true. We now have exactly the log we’d want:

Pretty log

$ TravisConsole/run-dotnet.sh 2
Before dotnet run (first)
Line 1
Line 2
After dotnet run (first)
Before dotnet run (second)
Line 1
Line 2
After dotnet run (second)
The command "TravisConsole/run-dotnet.sh 2" exited with 0.

Raw log

[0K$ TravisConsole/run-dotnet.sh 2
Before dotnet run (first)
Line 1
Line 2
After dotnet run (first)
Before dotnet run (second)
Line 1
Line 2
After dotnet run (second)
travis_time:end:0bb5a6d4:start=1595144448986411002,finish=1595144453476210113,duration=4489799111,event=script
[0K[32;1mThe command "TravisConsole/run-dotnet.sh 2" exited with 0.[0m

Conclusion

The use of mystery as the value of the TERM environment variable isn’t special, other than “not being a terminal that either Travis or .NET Core will have any fixed expectations about”. I expect that .NET Core is trying to be clever with its output based on the TERM environment variable, and that Travis isn’t handling the control characters in quite the way that .NET Core expects it to. Which one is right, and which one is wrong? It doesn’t really matter to me, so long as I can fix it.

This does potentially have a cost, of course. Anything which would actually produce prettier output based on the TERM environment variable is being hampered by this change. But so far we haven’t seen any problems. (It certainly isn’t stopping our Travis logs from using colour, for example.)

I discovered the DOTNET_NOLOGO environment variable – introduced in .NET Core 3.1.301, I think – incidentally while researching this problem. It’s not strictly related to the core problem, but it is related to the matter of “making CI logs readable” so I thought I’d include it here.

I was rather surprised not to see complaints about this all over the place. As you can see from the code above, it’s not like I’m doing anything particularly “special” – just writing lines out to the console. Are other developers not having the same problem, or just not noticing the problem? Either way, I hope this post helps either the .NET Core team to dive deeper, find out what’s going on and fix it (talking to the Travis team if appropriate), or at least raise awareness of the issue so that others can apply the same workaround.

New and improved JonSkeet.DemoUtil

It’s amazing how sometimes small changes can make you very happy.

This week I was looking at how DragonFruit does its entry point magic, and realized I had a great use case for the same kind of thing.

Some of my oldest code that’s still in regular use is ApplicationChooser – a simple tool for demos at conferences and user groups. Basically it allows you to write multiple classes with Main methods in a single project, and when you run it, it allows you to choose which one you actually want to run.

Until today, as well as installing the NuGet package, you had to create a Program.cs that calling ApplicationChooser.Run directly, and then explicitly set that as the entry point. But no more! That can all be done via build-time targets, so now it’s very simple, and there’s no extraneous code to explain away. Here’s a quick walkthrough for anyone who would like to adopt it for their own demos.

Create a console project

It’s just a vanilla console app…

$ mkdir FunkyDemo
$ cd FunkyDemo
$ dotnet new console

Add the package, and remove the previous Program.cs

You don’t have to remove Program.cs, but you probably should. Or you could use that as an entry point if you really want.

$ dotnet add package JonSkeet.DemoUtil
$ rm Program.cs

Add demo code

For example, add two files, Demo1.cs and Demo2.cs

// Demo1.cs
using System;

namespace FunkyDemo
{
    class Demo1
    {
        static void Main() =>
            Console.WriteLine("Simple example without description");
    }
}

// Demo2.cs
using System;
using System.ComponentModel;
using System.Threading.Tasks;

namespace FunkyDemo
{
    // Optional description to display in the menu
    [Description("Second demo")]
    class Demo2
    {
        // Async entry points are supported,
        // as well as the original command line args
        static async Task Main(string[] args)
        {
            foreach (var arg in args)
            {
                Console.WriteLine(arg);
                await Task.Delay(500);
            }
        }
    }
}

Run!

$ dotnet run -- abc def ghi
0: Demo1
1: [Second demo] Demo2

Entry point to run (or hit return to quit)?

Conclusion

That’s all there is to it – it’s simple in scope, implementation and usage. Nothing earth-shattering, for sure – but if you give lots of demos with console applications, as I do, it makes life a lot simpler than having huge numbers of separate projects.